

The glycine transporter GlyT1 controls N-methyl-D-aspartic acid receptor coagonist occupancy in the mouse retina
- PMID: 20092573
- PMCID: PMC2910544
- DOI: 10.1111/j.1460-9568.2009.07020.x
The glycine transporter GlyT1 controls N-methyl-D-aspartic acid receptor coagonist occupancy in the mouse retina
Abstract
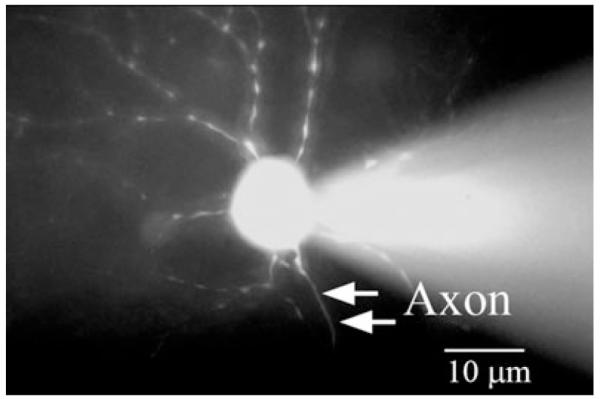
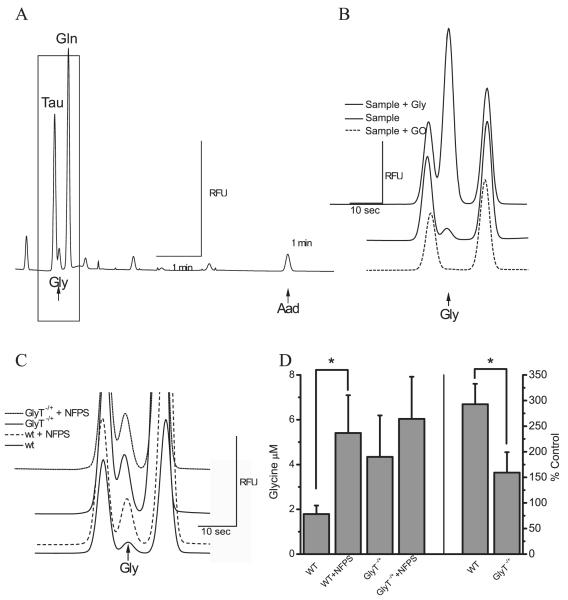
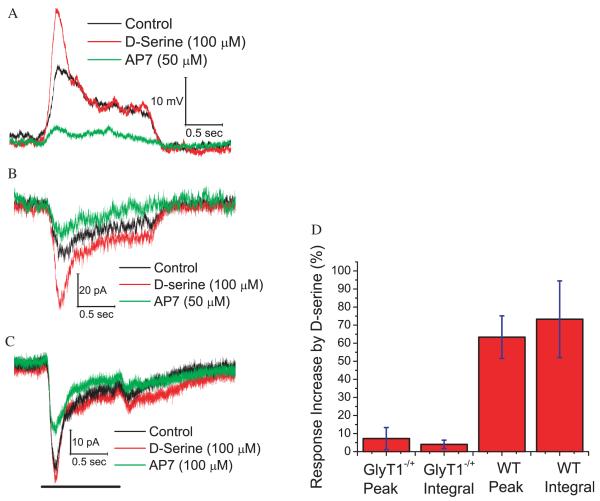
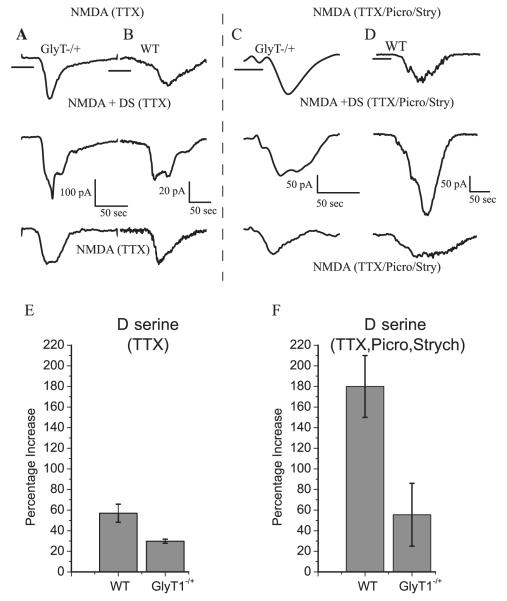
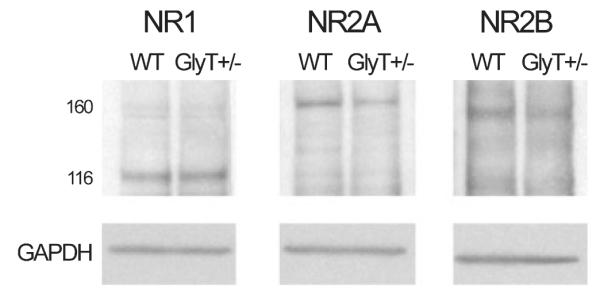
We examined the role of GlyT1, the high-affinity glycine transporter, in the mouse retina with an emphasis on the role of glycine as a coagonist of N-methyl-D-aspartic acid (NMDA) receptors. We pursued this objective by studying heterozygote mice deficient in the GlyT1 transporter (GlyT1(-/+)) and compared those results with wild-type (WT) littermate controls (GlyT1(+/+)). Capillary electrophoresis was used to separate and quantitatively measure glycine release from isolated retina preparations; pharmacologically blocking GlyT1 with N-[3-([1,1-biphenyl]-4-yloxy)-3-(4-fluorophenyl)propyl]-N-methylglycine in the WT retina generated a significantly larger accumulation of glycine into the bathing environment when compared with the GlyT1(-/+) retinas. The relative occupancy state of the NMDA receptor coagonist sites was tested using whole-cell recordings from ganglion cells while bath applying D-serine or D-serine + NMDA. The interpretation of these studies was simplified by blocking post-synaptic inhibition with picrotoxinin and strychnine. NMDA receptor coagonist sites were more saturated and less enhanced by D-serine in the GlyT1(-/+) mice compared with the WT controls. Immunoblots of NMDA receptor subunits (NR1, NR2A and NR2B) in WT and GlyT1(-/+) animals showed that the NR1 subunits were identical. These observations are discussed in view of contemporary issues about NMDA receptor coagonist function in the vertebrate retina and the role of glycine vs. D-serine as the endogenous coagonist.
Figures
Similar articles
-
AMPA receptor-dependent, light-evoked D-serine release acts on retinal ganglion cell NMDA receptors.J Neurophysiol. 2012 Aug;108(4):1044-51. doi: 10.1152/jn.00264.2012. Epub 2012 May 16. J Neurophysiol. 2012. PMID: 22592312 Free PMC article.
-
Glycine transporter 1 modulates GABA release from amacrine cells by controlling occupancy of coagonist binding site of NMDA receptors.J Neurophysiol. 2013 Sep;110(6):1393-403. doi: 10.1152/jn.00193.2013. Epub 2013 Jun 26. J Neurophysiol. 2013. PMID: 23803324 Free PMC article.
-
Glycine transport accounts for the differential role of glycine vs. D-serine at NMDA receptor coagonist sites in the salamander retina.Eur J Neurosci. 2010 Mar;31(5):808-16. doi: 10.1111/j.1460-9568.2010.07135.x. Eur J Neurosci. 2010. PMID: 20374282 Free PMC article.
-
Glycine transporter type-1 and its inhibitors.Curr Med Chem. 2006;13(9):1017-44. doi: 10.2174/092986706776360932. Curr Med Chem. 2006. PMID: 16611082 Review.
-
Allosteric modulation of NMDA receptor via elevation of brain glycine and D-serine: the therapeutic potentials for schizophrenia.Pharmacol Ther. 2008 Dec;120(3):317-32. doi: 10.1016/j.pharmthera.2008.08.004. Epub 2008 Aug 27. Pharmacol Ther. 2008. PMID: 18805436 Review.
Cited by
-
The postnatal development of D-serine in the retinas of two mouse strains, including a mutant mouse with a deficiency in D-amino acid oxidase and a serine racemase knockout mouse.ACS Chem Neurosci. 2014 Sep 17;5(9):848-54. doi: 10.1021/cn5000106. Epub 2014 Aug 1. ACS Chem Neurosci. 2014. PMID: 25083578 Free PMC article.
-
AMPA receptor-dependent, light-evoked D-serine release acts on retinal ganglion cell NMDA receptors.J Neurophysiol. 2012 Aug;108(4):1044-51. doi: 10.1152/jn.00264.2012. Epub 2012 May 16. J Neurophysiol. 2012. PMID: 22592312 Free PMC article.
-
Dynamic regulation of D-serine release in the vertebrate retina.J Physiol. 2015 Feb 15;593(4):843-56. doi: 10.1113/jphysiol.2014.283432. Epub 2015 Jan 7. J Physiol. 2015. PMID: 25480802 Free PMC article.
-
Effects of D-serine treatment on outer retinal function.Exp Eye Res. 2021 Oct;211:108732. doi: 10.1016/j.exer.2021.108732. Epub 2021 Aug 20. Exp Eye Res. 2021. PMID: 34419444 Free PMC article.
-
Identification of HMX1 target genes: a predictive promoter model approach.Mol Vis. 2013 Aug 6;19:1779-94. eCollection 2013. Mol Vis. 2013. PMID: 23946633 Free PMC article.
References
-
- Ames A, III, Nesbett FB. In vitro retina as an experimental model of the central nervous system. J. Neurochem. 1981;37:867–877. - PubMed
-
- Broer A, Brookes N, Ganapathy V, Dimmer KS, Wagner CA, Lang F, Broer S. The astroglial ASCT2 amino acid transporter as a mediator of glutamine efflux. J. Neurochem. 1999;73:2184–2194. - PubMed
-
- Burkhardt DA. Proximal negative response of frog retina. J. Neurophysiol. 1970;33:405–420. - PubMed
MeSH terms
Substances
Grants and funding
LinkOut - more resources
Full Text Sources
Molecular Biology Databases
