

Electrophysiological evidence of mediolateral functional dichotomy in the rat accumbens during cocaine self-administration: tonic firing patterns
- PMID: 20092580
- PMCID: PMC3004473
- DOI: 10.1111/j.1460-9568.2009.07033.x
Electrophysiological evidence of mediolateral functional dichotomy in the rat accumbens during cocaine self-administration: tonic firing patterns
Abstract
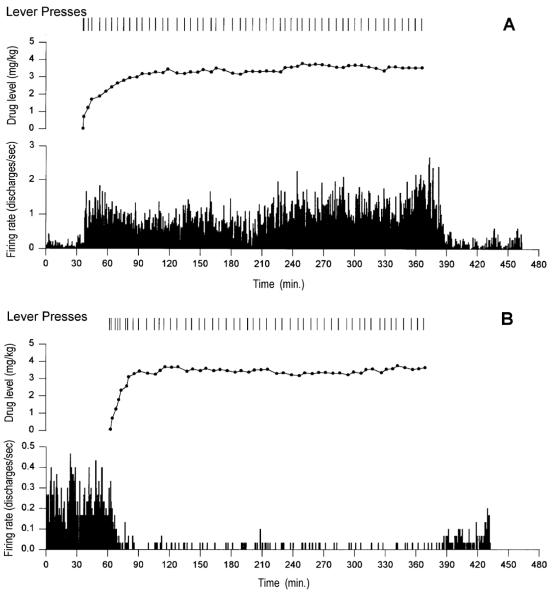
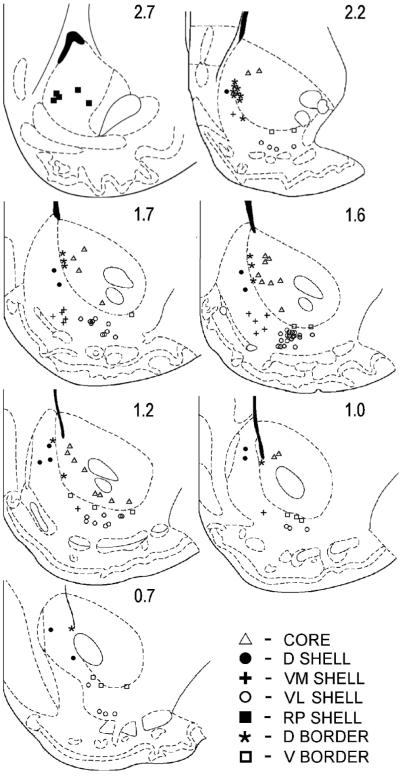
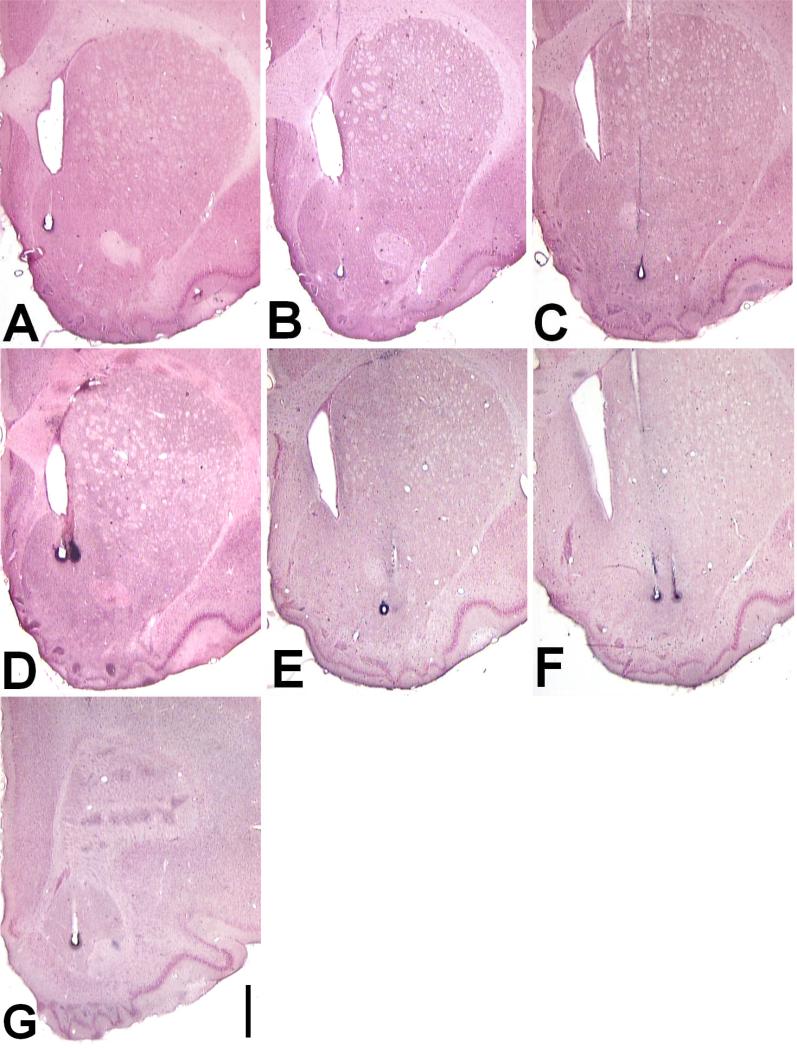
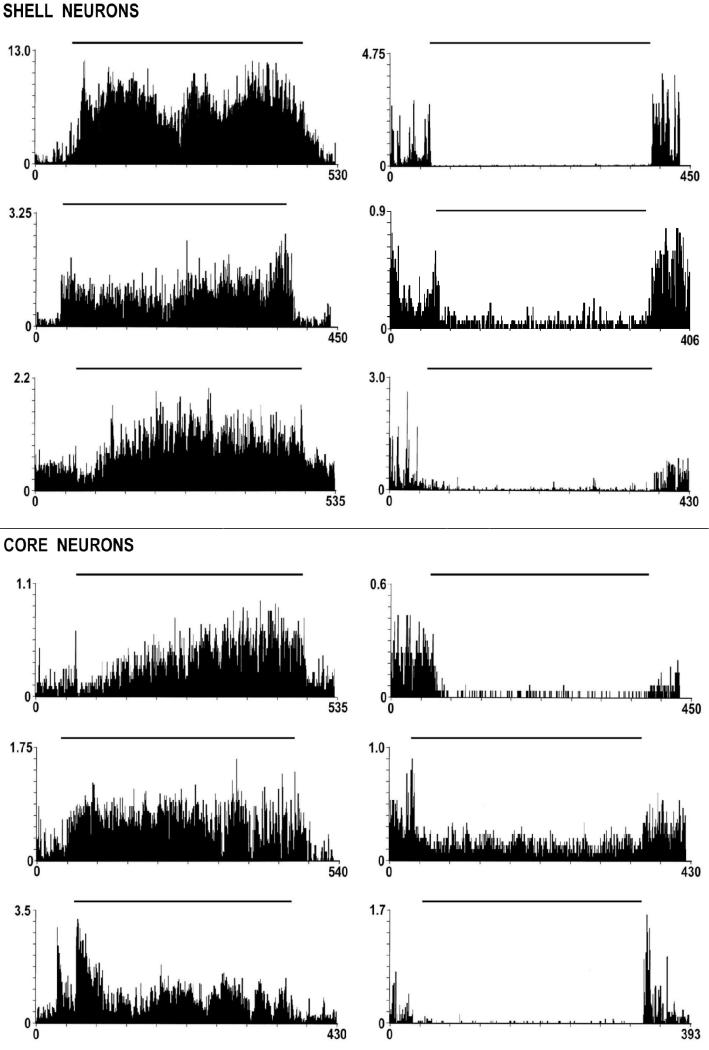
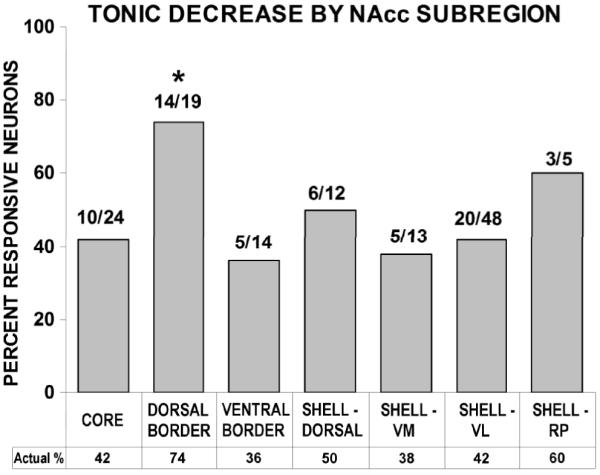
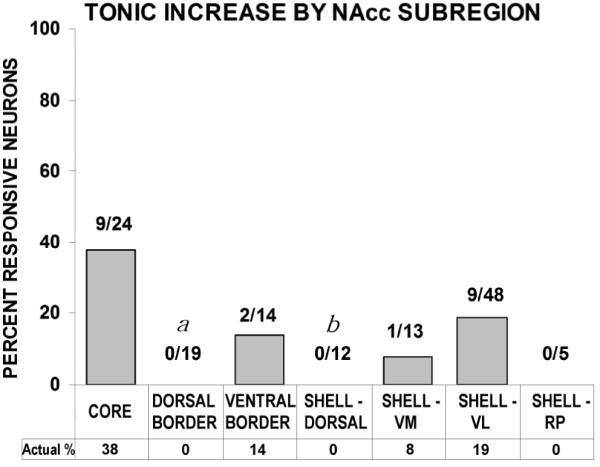
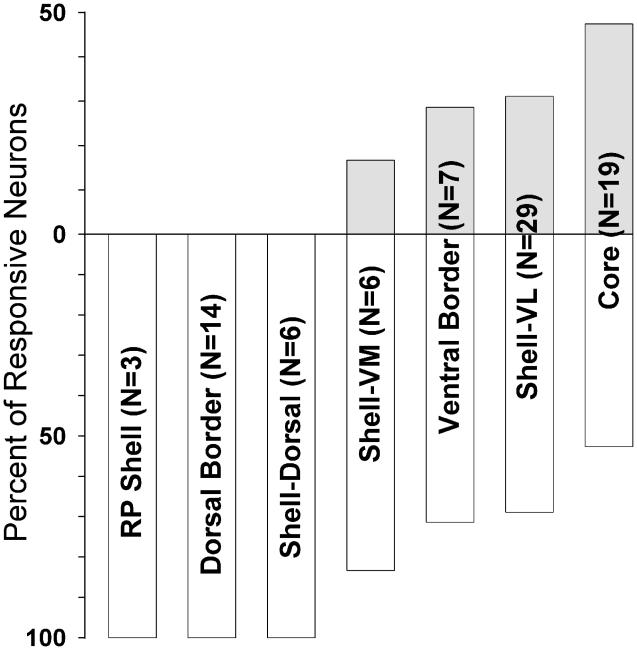
Given the increasing research emphasis on putative accumbal functional compartmentation, we sought to determine whether neurons that demonstrate changes in tonic firing rate during cocaine self-administration are differentially distributed across subregions of the NAcc. Rats were implanted with jugular catheters and microwire arrays targeting NAcc subregions (core, dorsal shell, ventromedial shell, ventrolateral shell and rostral pole shell). Recordings were obtained after acquisition of stable cocaine self-administration (0.77 mg/kg/0.2mL infusion; fixed-ratio 1 schedule of reinforcement; 6-h daily sessions). During the self-administration phase of the experiment, neurons demonstrated either: (i) tonic suppression (or decrease); (ii) tonic activation (or increase); or (iii) no tonic change in firing rate with respect to rates of firing during pre- and post-drug phases. Consistent with earlier observations, tonic decrease was the predominant firing pattern observed. Differences in the prevalence of tonic increase firing were observed between the core and the dorsal shell and dorsal shell-core border regions, with the latter two areas exhibiting a virtual absence of tonic increases. Tonic suppression was exhibited to a greater extent by the dorsal shell-core border region relative to the core. These differences could reflect distinct subregional afferent processing and/or differential sensitivity of subpopulations of NAcc neurons to cocaine. Ventrolateral shell firing topographies resembled those of core neurons. Taken together, these observations are consistent with an emerging body of literature that differentiates the accumbens mediolaterally and further advances the likelihood that distinct functions are subserved by NAcc subregions in appetitive processing.
Figures
Similar articles
-
Slow phasic and tonic activity of ventral pallidal neurons during cocaine self-administration.Synapse. 2012 Feb;66(2):106-27. doi: 10.1002/syn.20990. Epub 2011 Nov 3. Synapse. 2012. PMID: 21953543 Free PMC article.
-
Electrophysiological evidence of mediolateral functional dichotomy in the rat nucleus accumbens during cocaine self-administration II: phasic firing patterns.Eur J Neurosci. 2010 May;31(9):1671-82. doi: 10.1111/j.1460-9568.2010.07230.x. Eur J Neurosci. 2010. PMID: 20525080 Free PMC article.
-
Higher magnitude accumbal phasic firing changes among core neurons exhibiting tonic firing increases during cocaine self-administration.Neuroscience. 2006 Feb;137(3):1075-85. doi: 10.1016/j.neuroscience.2005.10.026. Epub 2005 Dec 1. Neuroscience. 2006. PMID: 16325346
-
Differential changes in signal and background firing of accumbal neurons during cocaine self-administration.J Neurophysiol. 2003 Aug;90(2):993-1010. doi: 10.1152/jn.00849.2002. J Neurophysiol. 2003. PMID: 12904500
-
Tonic firing of rat nucleus accumbens neurons: changes during the first 2 weeks of daily cocaine self-administration sessions.Brain Res. 1999 Mar 20;822(1-2):231-6. doi: 10.1016/s0006-8993(98)01271-2. Brain Res. 1999. PMID: 10082901
Cited by
-
Rapid phasic activity of ventral pallidal neurons during cocaine self-administration.Synapse. 2010 Sep;64(9):704-13. doi: 10.1002/syn.20792. Synapse. 2010. PMID: 20340176 Free PMC article.
-
Slow phasic and tonic activity of ventral pallidal neurons during cocaine self-administration.Synapse. 2012 Feb;66(2):106-27. doi: 10.1002/syn.20990. Epub 2011 Nov 3. Synapse. 2012. PMID: 21953543 Free PMC article.
-
Nucleus accumbens shell neurons' early sensitivity to cocaine is associated with future increases in drug intake.Addict Neurosci. 2023 Dec;8:100107. doi: 10.1016/j.addicn.2023.100107. Epub 2023 Jun 14. Addict Neurosci. 2023. PMID: 37664219 Free PMC article.
-
The ventral pallidum: Subregion-specific functional anatomy and roles in motivated behaviors.Prog Neurobiol. 2015 Jul;130:29-70. doi: 10.1016/j.pneurobio.2015.03.005. Epub 2015 Apr 6. Prog Neurobiol. 2015. PMID: 25857550 Free PMC article. Review.
-
Chronic Fentanyl Self-Administration Generates a Shift toward Negative Affect in Rats during Drug Use.Brain Sci. 2021 Aug 13;11(8):1064. doi: 10.3390/brainsci11081064. Brain Sci. 2021. PMID: 34439683 Free PMC article.
References
-
- Alexander GE, DeLong MR, Strick PL. Parallel organization of functionally segregated circuits linking basal ganglia and cortex. Annu. Rev. Neurosci. 1986;9:357–381. - PubMed
-
- Berendse HW, Galis-de Graaf Y, Groenewegen HJ. Topographical organization and relationship with ventral striatal compartments of prefrontal corticostriatal projections in the rat. J. Comp. Neurol. 1992a;316(3):314–347. - PubMed
-
- Blaha CD, Yang CR, Floresco SB, Barr AM, Phillips AG. Stimulation of the ventral subiculum of the hippocampus evokes glutamate receptor-mediated changes in dopamine efflux in the rat nucleus accumbens. Eur. J. Neurosci. 1997;9:902–911. - PubMed
-
- Boeijinga PH, Pennartz CMA, da Silva F.H. Lopes. Paired pulse facilitation in the nucleus accumbens following stimulation of subicular inputs in the rat. Neuroscience. 1990;35(2):301–311. - PubMed
Publication types
MeSH terms
Substances
Grants and funding
LinkOut - more resources
Full Text Sources
