

Genome-wide computational prediction of tandem gene arrays: application in yeasts
- PMID: 20092627
- PMCID: PMC2822764
- DOI: 10.1186/1471-2164-11-56
Genome-wide computational prediction of tandem gene arrays: application in yeasts
Abstract
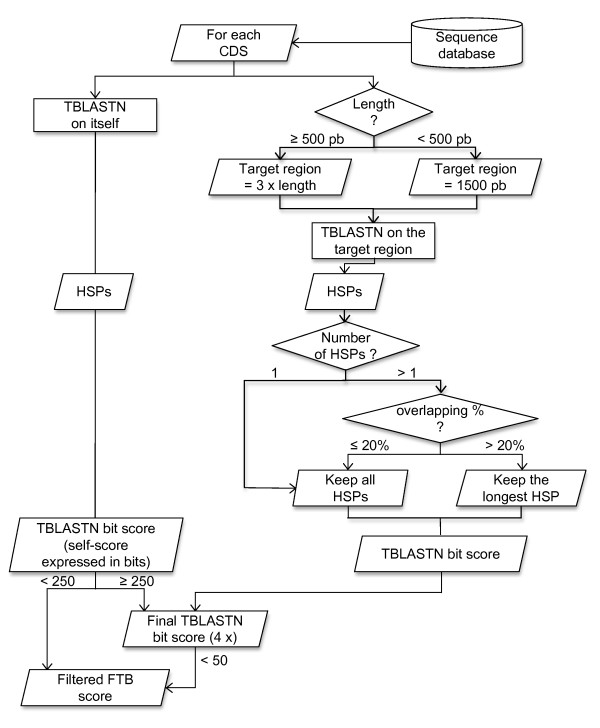
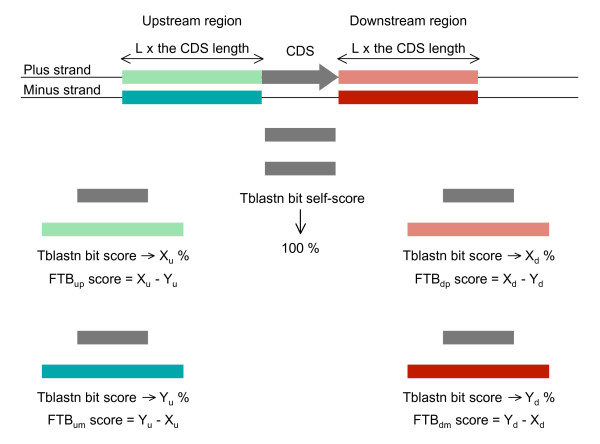
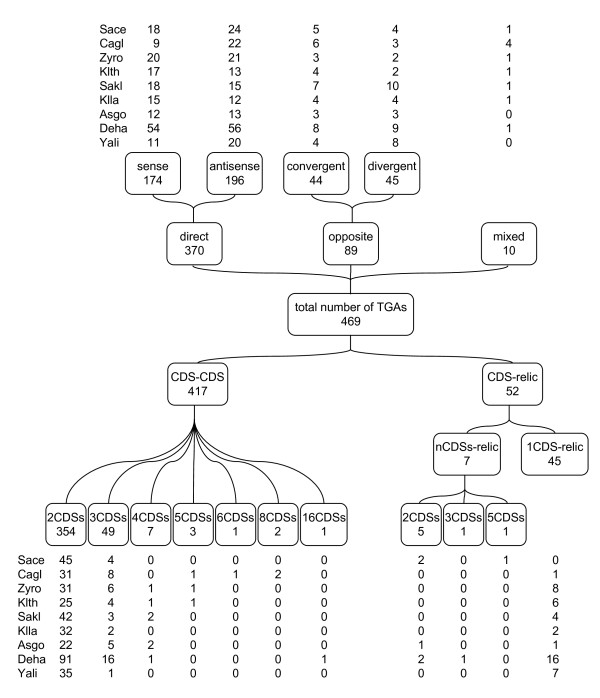
Background: This paper describes an efficient in silico method for detecting tandem gene arrays (TGAs) in fully sequenced and compact genomes such as those of prokaryotes or unicellular eukaryotes. The originality of this method lies in the search of protein sequence similarities in the vicinity of each coding sequence, which allows the prediction of tandem duplicated gene copies independently of their functionality.
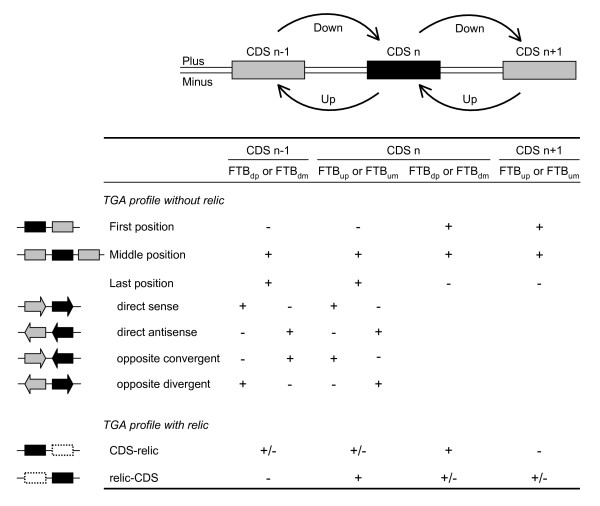
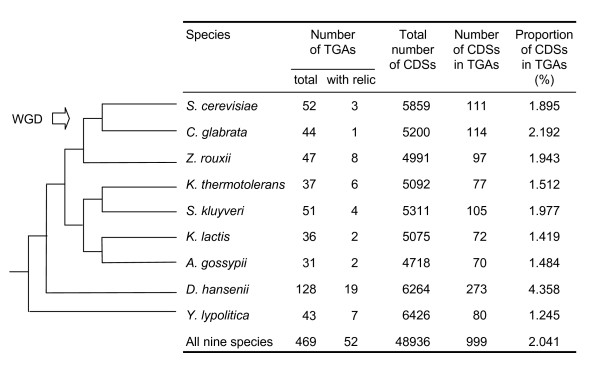
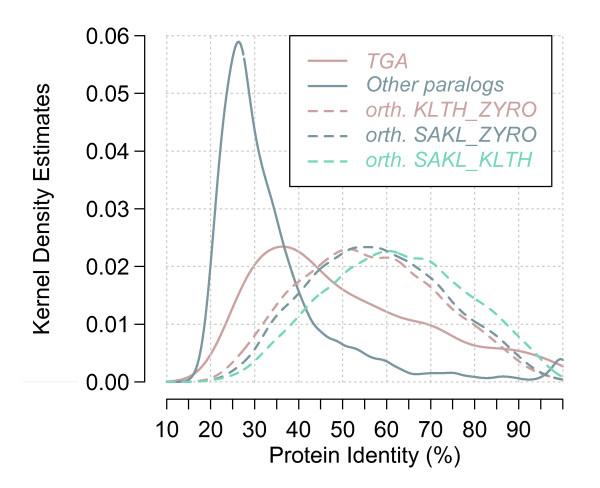
Results: Applied to nine hemiascomycete yeast genomes, this method predicts that 2% of the genes are involved in TGAs and gene relics are present in 11% of TGAs. The frequency of TGAs with degenerated gene copies means that a significant fraction of tandem duplicated genes follows the birth-and-death model of evolution. A comparison of sequence identity distributions between sets of homologous gene pairs shows that the different copies of tandem arrayed paralogs are less divergent than copies of dispersed paralogs in yeast genomes. It suggests that paralogs included in tandem structures are more recent or more subject to the gene conversion mechanism than other paralogs.
Conclusion: The method reported here is a useful computational tool to provide a database of TGAs composed of functional or nonfunctional gene copies. Such a database has obvious applications in the fields of structural and comparative genomics. Notably, a detailed study of the TGA catalog will make it possible to tackle the fundamental questions of the origin and evolution of tandem gene clusters.
Figures
Similar articles
-
Tandem gene arrays, plastic chromosomal organizations.C R Biol. 2011 Aug-Sep;334(8-9):639-46. doi: 10.1016/j.crvi.2011.05.012. Epub 2011 Jul 5. C R Biol. 2011. PMID: 21819945 Review.
-
Yeast genome sequencing: the power of comparative genomics.Mol Microbiol. 2004 Jul;53(2):381-9. doi: 10.1111/j.1365-2958.2004.04182.x. Mol Microbiol. 2004. PMID: 15228521 Review.
-
Automatic clustering of orthologs and in-paralogs from pairwise species comparisons.J Mol Biol. 2001 Dec 14;314(5):1041-52. doi: 10.1006/jmbi.2000.5197. J Mol Biol. 2001. PMID: 11743721
-
Molecular evolution of minisatellites in hemiascomycetous yeasts.Mol Biol Evol. 2006 Jan;23(1):189-202. doi: 10.1093/molbev/msj022. Epub 2005 Sep 21. Mol Biol Evol. 2006. PMID: 16177231
-
The PathoYeastract database: an information system for the analysis of gene and genomic transcription regulation in pathogenic yeasts.Nucleic Acids Res. 2017 Jan 4;45(D1):D597-D603. doi: 10.1093/nar/gkw817. Epub 2016 Sep 12. Nucleic Acids Res. 2017. PMID: 27625390 Free PMC article.
Cited by
-
An Overview of Duplicated Gene Detection Methods: Why the Duplication Mechanism Has to Be Accounted for in Their Choice.Genes (Basel). 2020 Sep 4;11(9):1046. doi: 10.3390/genes11091046. Genes (Basel). 2020. PMID: 32899740 Free PMC article. Review.
-
Expression attenuation as a mechanism of robustness against gene duplication.Proc Natl Acad Sci U S A. 2021 Feb 9;118(6):e2014345118. doi: 10.1073/pnas.2014345118. Proc Natl Acad Sci U S A. 2021. PMID: 33526669 Free PMC article.
-
Detecting long tandem duplications in genomic sequences.BMC Bioinformatics. 2012 May 8;13:83. doi: 10.1186/1471-2105-13-83. BMC Bioinformatics. 2012. PMID: 22568762 Free PMC article.
-
Colocality to Cofunctionality: Eukaryotic Gene Neighborhoods as a Resource for Function Discovery.Mol Biol Evol. 2021 Jan 23;38(2):650-662. doi: 10.1093/molbev/msaa221. Mol Biol Evol. 2021. PMID: 32886760 Free PMC article.
-
Diatom heterotrophy on brown algal polysaccharides emerged through horizontal gene transfer, gene duplication, and neofunctionalization.PLoS Biol. 2025 Apr 1;23(4):e3003038. doi: 10.1371/journal.pbio.3003038. eCollection 2025 Apr. PLoS Biol. 2025. PMID: 40168346 Free PMC article.
References
Publication types
MeSH terms
LinkOut - more resources
Full Text Sources
Molecular Biology Databases
