

Bicarbonate enhances expression of the endocarditis and biofilm associated pilus locus, ebpR-ebpABC, in Enterococcus faecalis
- PMID: 20092636
- PMCID: PMC2824692
- DOI: 10.1186/1471-2180-10-17
Bicarbonate enhances expression of the endocarditis and biofilm associated pilus locus, ebpR-ebpABC, in Enterococcus faecalis
Abstract
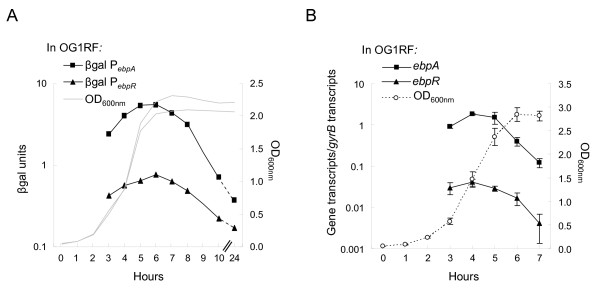
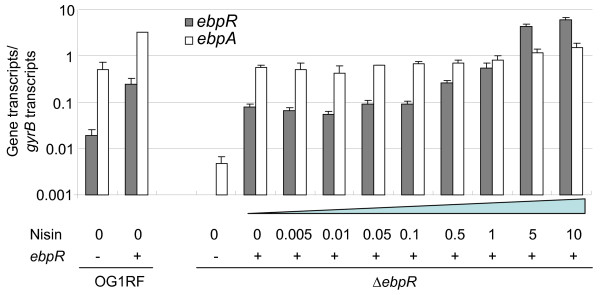
Background: We previously identified ebpR, encoding a potential member of the AtxA/Mga transcriptional regulator family, and showed that it is important for transcriptional activation of the Enterococcus faecalis endocarditis and biofilm associated pilus operon, ebpABC. Although ebpR is not absolutely essential for ebpABC expression (100-fold reduction), its deletion led to phenotypes similar to those of an ebpABC mutant such as absence of pili at the cell surface and, consequently, reduced biofilm formation. A non-piliated ebpABC mutant has been shown to be attenuated in a rat model of endocarditis and in a murine urinary tract infection model, indicating an important participation of the ebpR-ebpABC locus in virulence. However, there is no report relating to the environmental conditions that affect expression of the ebpR-ebpABC locus.
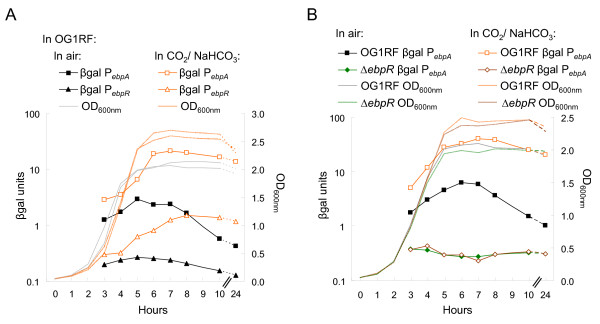
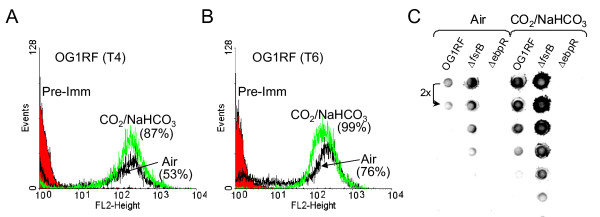
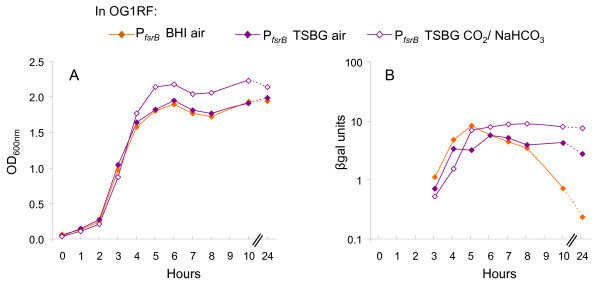
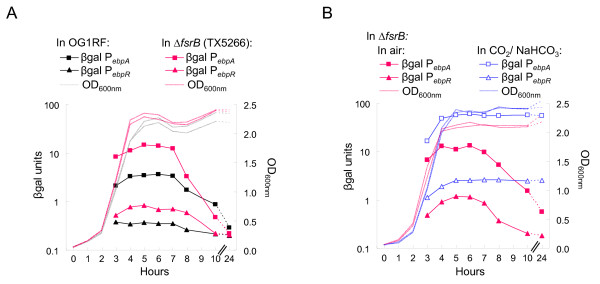
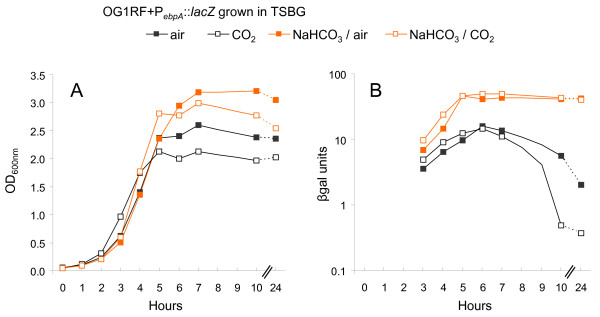
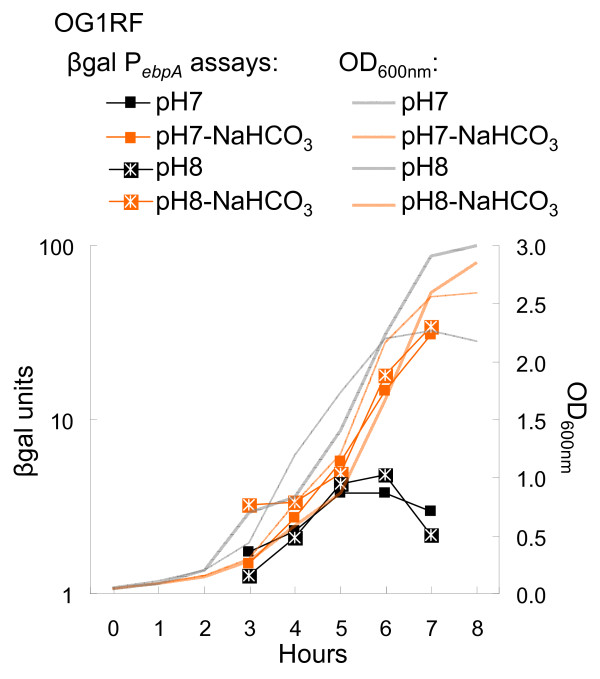
Results: In this study, we examined the effect of CO2/HCO3(-), pH, and the Fsr system on the ebpR-ebpABC locus expression. The presence of 5% CO2/0.1 M HCO3(-) increased ebpR-ebpABC expression, while the Fsr system was confirmed to be a weak repressor of this locus. The mechanism by which the Fsr system repressed the ebpR-ebpABC locus expression appears independent of the effects of CO2(-) bicarbonate. Furthermore, by using an ebpA::lacZ fusion as a reporter, we showed that addition of 0.1 M sodium bicarbonate to TSBG (buffered at pH 7.5), but not the presence of 5% CO2, induced ebpA expression in TSBG broth. In addition, using microarray analysis, we found 73 genes affected by the presence of sodium bicarbonate (abs(fold) > 2, P < 0.05), the majority of which belong to the PTS system and ABC transporter families. Finally, pilus production correlated with ebpA mRNA levels under the conditions tested.
Conclusions: This study reports that the ebp locus expression is enhanced by the presence of bicarbonate with a consequential increase in the number of cells producing pili. Although the molecular basis of the bicarbonate effect remains unclear, the pathway is independent of the Fsr system. In conclusion, E. faecalis joins the growing family of pathogens that regulates virulence gene expression in response to bicarbonate and/or CO2.
Figures
Similar articles
-
EbpR is important for biofilm formation by activating expression of the endocarditis and biofilm-associated pilus operon (ebpABC) of Enterococcus faecalis OG1RF.J Bacteriol. 2007 Sep;189(17):6490-3. doi: 10.1128/JB.00594-07. Epub 2007 Jun 22. J Bacteriol. 2007. PMID: 17586623 Free PMC article.
-
Characterization of the ebp(fm) pilus-encoding operon of Enterococcus faecium and its role in biofilm formation and virulence in a murine model of urinary tract infection.Virulence. 2010 Jul-Aug;1(4):236-46. doi: 10.4161/viru.1.4.11966. Virulence. 2010. PMID: 20676385 Free PMC article.
-
Conservation of Ebp-type pilus genes among Enterococci and demonstration of their role in adherence of Enterococcus faecalis to human platelets.Infect Immun. 2011 Jul;79(7):2911-20. doi: 10.1128/IAI.00039-11. Epub 2011 Apr 18. Infect Immun. 2011. PMID: 21502588 Free PMC article.
-
The metal ion-dependent adhesion site motif of the Enterococcus faecalis EbpA pilin mediates pilus function in catheter-associated urinary tract infection.mBio. 2012 Jul 24;3(4):e00177-12. doi: 10.1128/mBio.00177-12. Print 2012. mBio. 2012. PMID: 22829678 Free PMC article.
-
Molecular Mechanism of Quorum-Sensing in Enterococcus faecalis: Its Role in Virulence and Therapeutic Approaches.Int J Mol Sci. 2017 May 3;18(5):960. doi: 10.3390/ijms18050960. Int J Mol Sci. 2017. PMID: 28467378 Free PMC article. Review.
Cited by
-
Bacterial cell surface heterogeneity: a pathogen's disguise.PLoS Pathog. 2012;8(8):e1002821. doi: 10.1371/journal.ppat.1002821. Epub 2012 Aug 30. PLoS Pathog. 2012. PMID: 22952444 Free PMC article. No abstract available.
-
Contribution of individual Ebp Pilus subunits of Enterococcus faecalis OG1RF to pilus biogenesis, biofilm formation and urinary tract infection.PLoS One. 2013 Jul 11;8(7):e68813. doi: 10.1371/journal.pone.0068813. Print 2013. PLoS One. 2013. PMID: 23874774 Free PMC article.
-
Physiological role of bicarbonate in microbes: A double-edged sword?Virulence. 2025 Dec;16(1):2474865. doi: 10.1080/21505594.2025.2474865. Epub 2025 Mar 6. Virulence. 2025. PMID: 40047280 Free PMC article. Review.
-
The rise of the Enterococcus: beyond vancomycin resistance.Nat Rev Microbiol. 2012 Mar 16;10(4):266-78. doi: 10.1038/nrmicro2761. Nat Rev Microbiol. 2012. PMID: 22421879 Free PMC article. Review.
-
Targeting agr- and agr-Like quorum sensing systems for development of common therapeutics to treat multiple gram-positive bacterial infections.Sensors (Basel). 2013 Apr 18;13(4):5130-66. doi: 10.3390/s130405130. Sensors (Basel). 2013. PMID: 23598501 Free PMC article. Review.
References
-
- Murray BE. In: Infectious diseases. 2. Gorbach SL, Bartlett JG, Blacklow NR, editor. W. B. Saunders Company, Philadelphia, Pa; 1998. Enterococci; pp. 1723–1730.
Publication types
MeSH terms
Substances
Grants and funding
LinkOut - more resources
Full Text Sources
