. 2010 Apr 1;48(7):905-14.
doi: 10.1016/j.freeradbiomed.2010.01.015. Epub 2010 Jan 20.

Mitochondrial reserve capacity in endothelial cells: The impact of nitric oxide and reactive oxygen species

Affiliations

Mitochondrial reserve capacity in endothelial cells: The impact of nitric oxide and reactive oxygen species

Brian P Dranka et al. Free Radic Biol Med. .

Abstract

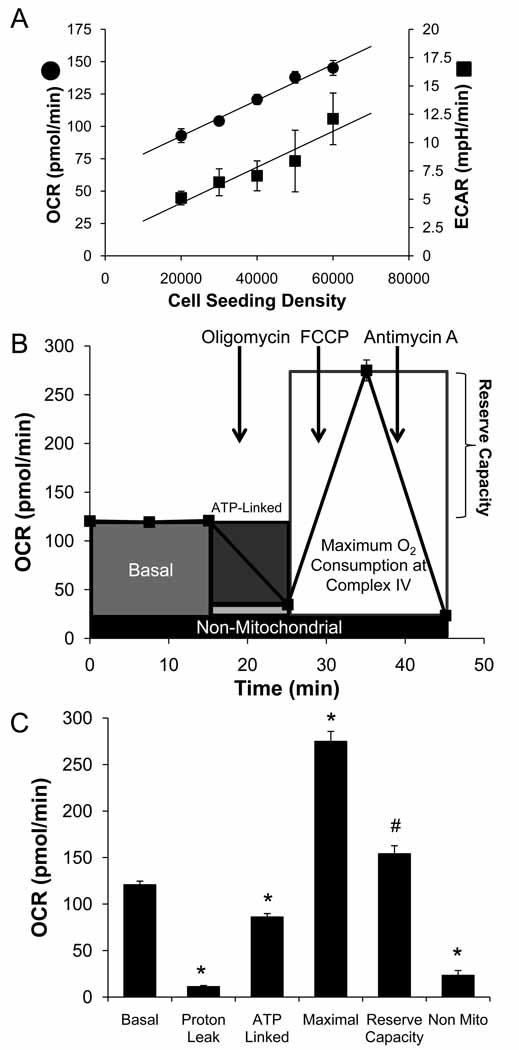
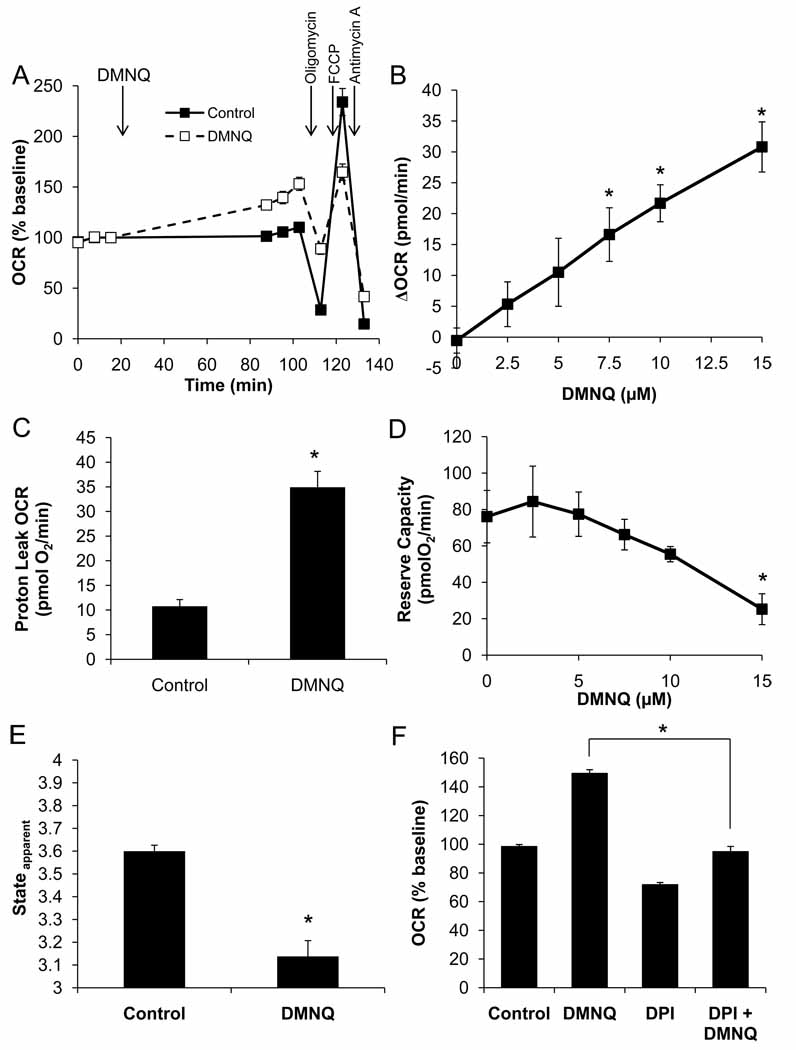
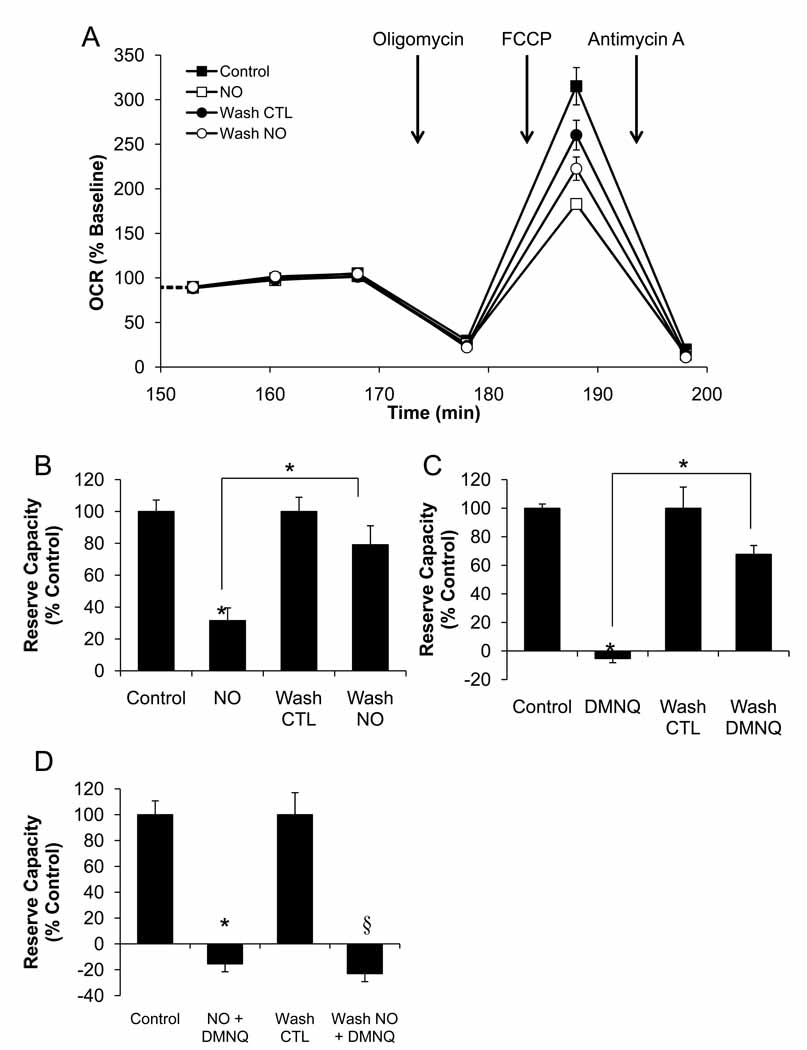
The endothelium is not considered to be a major energy-requiring organ, but nevertheless endothelial cells have an extensive mitochondrial network. This suggests that mitochondrial function may be important in response to stress and signaling in these cells. In this study, we used extracellular flux analysis to measure mitochondrial function in adherent bovine aortic endothelial cells (BAEC). Under basal conditions, BAEC use only approximately 35% of their maximal respiratory capacity. We calculate that this represents an intermediate respiratory state between States 3 and 4, which we define as State(apparent) equal to 3.64. Interestingly, the apparent respiratory control ratio (maximal mitochondrial oxygen consumption/non-ADP-linked respiration) in these cells is on the order of 23, which is substantially higher than that which is frequently obtained with isolated mitochondria. These results suggest that mitochondria in endothelial cells are highly coupled and possess a considerable bioenergetic reserve. Because endothelial cells are exposed to both reactive oxygen (ROS) and reactive nitrogen species in the course of vascular disease, we hypothesized that this reserve capacity is important in responding to oxidative stress. To test this, we exposed BAEC to NO or ROS alone or in combination. We found that exposure to nontoxic concentrations of NO or low levels of hydrogen peroxide generated from 2,3-dimethoxy-1,4-napthoquinone (DMNQ) had little impact on basal mitochondrial function but both treatments reversibly decreased mitochondrial reserve capacity. However, combined NO and DMNQ treatment resulted in an irreversible loss of reserve capacity and was associated with cell death. These data are consistent with a critical role for the mitochondrial reserve capacity in endothelial cells in responding to oxidative stress.


Figures

Figure 1
Figure 1. Measurement of Mitochondrial Function in BAEC using the XF24 analyzer
Seahorse Bioscience V7 Tissue Culture Plates were seeded with BAEC (20,000–60,000 cells/well) and allowed to grow for 24 h before the measurement of OCR and ECAR. Panel A: Basal OCR and ECAR were measured three times and plotted as a function of cell seeding number. Panel B represents the time course for measurement of OCR for 40,000 cells under the basal condition followed by the sequential addition of oligomycin (1 µg/ml), FCCP (1 µM), and antimycin A (10 µM) with a measurement of OCR and ECAR as indicated. This progress curve is annotated to show the relative contribution of non-respiratory chain oxygen consumption, ATP-linked oxygen consumption, the maximal OCR after the addition of FCCP, and the reserve capacity of the cells. The contribution of each of these parameters to the total cellular oxygen consumption is plotted in Panel C. All data are the mean ± sem, n≥3 per group. *, p<0.05 vs. Control; #, p<0.05 vs. Maximal OCR.
Figure 2
Figure 2. Apparent respiratory state increases with cell density
Panel A: The Stateapparent was calculated for cells seeded at 20,000–60,0000 cells/well. Panel B: Basal RCR and Maximal RCR values were determined for the cells seeded at 40,000 cells/well. Data shown are the mean ± sem, n≥3 per group. *, p<0.05 vs. Basal RCR.
Figure 3
Figure 3. Bioenergetic profile of BAEC treated with inhibitors of mitochondrial oxygen consumption
BAEC were seeded at 40,000 cells/well and treated with 10 µM Antimycin A, 1 µg/ml oligomycin, 1 µM rotenone, 10 µM TTFA, 1 mM cyanide, or 10 µM myxothiazole and OCR and ECAR were measured. The resulting effects on OCR and ECAR are plotted as a percentage of the baseline measurement for each treatment. Data shown are the mean ± sem. n≥3 per treatment group.
Figure 4
Figure 4. Acute nitric oxide treatment decreases reserve capacity, but has no effect on baseline oxygen consumption
BAEC were seeded at 40,000 cells/well and allowed to grow for 24 h. After a basal measurement of OCR, cells were treated without or with DetaNONOate (0–500 µM) for 1 h. Panel A: Representative traces for 0, 250, and 500 µM DetaNONOate. All cells were then treated sequentially with 1 µg/ml oligomycin, 1 µM FCCP and 10 µM antimycin A. Panel B: Effect of acute NO treatment on basal mitochondrial function. The third rate taken post-NO injection is plotted as a function of Deta NONOate concentration. Panel C: The change in FCCP-stimulated OCR is shown as a percentage increase from the original baseline and a function of Deta NONOate concentration. Panel D: Oxygen consumption as a result of mitochondrial activity was plotted in the absence or presence of 500 µM Deta NONOate. Data shown are the measured oxygen concentrations during the OCR measurement taken immediately following FCCP injection. Panel E: Mitochondrial reserve capacity in cells treated with Deta NONOate. Data shown are the mean ± sem, n≥3 per group.
Figure 5
Figure 5. Acute nitric oxide decreases Stateapparent and increases the extracellular acidification rate
BAEC were seeded at 40,000 cells/well and allowed to grow for 24 h. Deta NONOate was injected at the indicated concentrations, and the cells were allowed to incubate for 1 h. The Stateapparent was calculated using the third post-NO injection rate as the basal rate. The data are plotted as a function of Deta NONOate concentration (Panel A). The basal ECAR was determined for each treatment group and is plotted as a function of Deta NONOate concentration (Panel B). The net effect on the metabolic profile was determined by plotting OCR vs. ECAR for each Deta NONOate concentration (Panel C). Data shown are the mean ± sem, n≥3 per group. *, p<0.05 vs. Control.
Figure 6
Figure 6. Acute DMNQ treatment decreases maximal OCR
BAEC were seeded at 40,000 cells/well and allowed to grow for 24 h. Three baseline measurements of OCR and ECAR were made, and then cells were treated with DMNQ (15 µM) for 1 h. Following this treatment, three further measurements were performed prior to sequential injection of oligomycin (1 µg/ml), FCCP (1 µM), and antimycin A (10 µM) to determine mitochondrial function (Panel A). Panel B: The increase in basal OCR due to DMNQ was determined and is plotted as a function of DMNQ concentration. Panel C: Proton leak was calculated and is shown for control and DMNQ (15 µM)-treated cells. Panel D: Reserve capacity following DMNQ treatment is also plotted as a function of DMNQ concentration. Panel E: Apparent respiratory state was calculated as described and is shown for control and DMNQ (15 µM)-treated cells. Panel F: Diphenyleneiodonium (10 µM) was added with the DMNQ in some treatment groups. Inhibition of DMNQ-dependent OCR stimulation is shown. Data shown are the mean ± sem, n≥3 per group. *, p<0.05 vs. Control unless indicated otherwise.
Figure 7
Figure 7. Proton leak is stimulated by combined Deta NONOate and DMNQ treatment
BAEC were seeded at 40,000 cells/well and allowed to grow for 24 h. Three baseline measurements of OCR and ECAR were made and then cells were treated with Deta NONOate (250 µM) and DMNQ (15 µM) combined for 1 h. Following this treatment, three further measurements were performed prior to sequential injection of oligomycin (1µg/ml), FCCP (1µM), and antimycin A (10 µM) to determine mitochondrial function. Panel B: Proton leak was calculated as the oligomycin-insensitive OCR minus the antimycin A-insensitive OCR. The non-mitochondrial, or antimycin A-insensitive OCR was also determined (Panel C). Panel D: Cell viability was determined using the MTT assay for cells treated with 500 µM Deta NONOate and the indicated concentration of DMNQ as a cotreatment. Cell viability was calculated as a percentage of the control treated cells. Data shown are the mean ± sem, n≥3 per group. *, p<0.05 vs. Control. #, p<0.05 vs. matched concentration DMNQ-only control.
Figure 8
Figure 8. Reversal of OCR Inhibition is achieved following removal of Deta NONOate or DMNQ, but not these treatments combined
BAEC were seeded at 40,000 cells/well and allowed to grow for 24 h. Three baseline measurements of OCR were made, and then cells were treated with Deta NONOate (250 µM), DMNQ (15 µM), or both for 1 h. Following this treatment, three further measurements of OCR were performed. The plate was removed from the XF24, and the media changed to fresh assay media in the indicated groups. Three further measurements of basal OCR were then performed prior to sequential injection of oligomycin (1µg/ml), FCCP (1µM), and antimycin A (10 µM) to determine mitochondrial function. This portion of the experiment is shown in Panel A. Panel B: Reserve capacity was calculated for cells in the presence of Deta NONOate, or with the NO donor removed. Panel C: Reserve capacity was calculated for cells in the presence of DMNQ, or with the DMNQ removed. Panel D: Reserve capacity was calculated for cells in the presence of Deta NONOate and DMNQ combined, or with these compounds removed. Data shown are the mean ± sem, n=5 per group. *, p<0.05 vs. Control. §, p<0.05 vs. Wash control.
Figure 9
Figure 9. Chronic treatment with Deta NONOate decreases basal OCR
BAEC were seeded at 40,000 cells/well (Panel A), or 20,000 cells/well (Panel B) and allowed to grow for 24 hours. The cells were then treated with the indicated concentration of Deta NONOate for the indicated time. Basal OCR was then measured as described. Panel C: BAEC grown in 6-well plates were treated with the indicated concentration of Deta NONOate for 16 hours. Cells were lysed and harvested for protein analysis by SDS-PAGE and Western blotting. Representative blots for COX I and Vb are shown along with quantification of these proteins. Data shown are the mean ± sem. n≥3 per group. *, p<0.05 vs. Control.

References

    1. Palmer RMJ, Ferrige AG, Moncada S. Nitric oxide release accounts for the biological activity of endothelium-derived relaxing factor. Nature. 1987;327(6122):524–526. - PubMed
    1. Lee MY, Griendling KK. Redox signaling, vascular function, and hypertension. Antioxid Redox Signal. 2008;10(6):1045–1059. - PMC - PubMed
    1. Ramachandran A, et al. Inhibition of mitochondrial protein synthesis results in increased endothelial cell susceptibility to nitric oxide-induced apoptosis. PNAS. 2002;99(10):6643–6648. - PMC - PubMed
    1. Ramachandran A, et al. Activation of c-Jun N-Terminal Kinase and Apoptosis in Endothelial Cells Mediated by Endogenous Generation of Hydrogen Peroxide. Biological Chemistry. 2002;383(3):693. - PubMed
    1. Kotamraju S, et al. Nitric oxide inhibits H2O2-induced transferrin receptor-dependent apoptosis in endothelial cells: Role of ubiquitin-proteasome pathway. PNAS. 2003;100(19):10653–10658. - PMC - PubMed

LinkOut - more resources