

Suppression of adipocyte differentiation by aldo-keto reductase 1B3 acting as prostaglandin F2alpha synthase
- PMID: 20093363
- PMCID: PMC2838309
- DOI: 10.1074/jbc.M109.077164
Suppression of adipocyte differentiation by aldo-keto reductase 1B3 acting as prostaglandin F2alpha synthase
Abstract
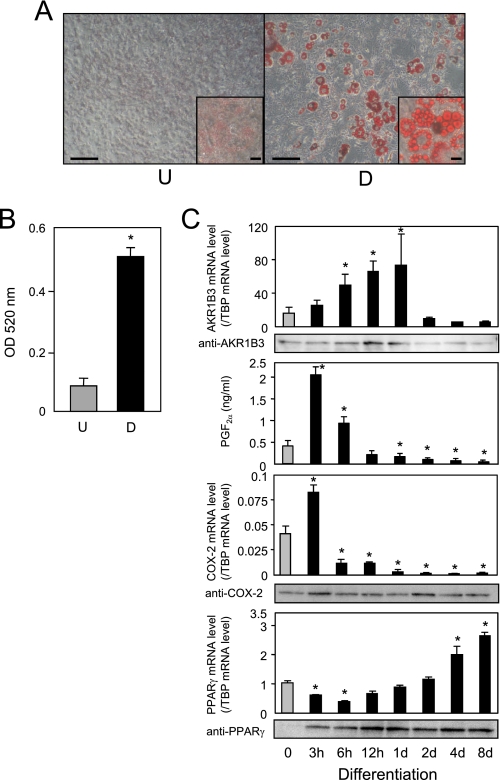
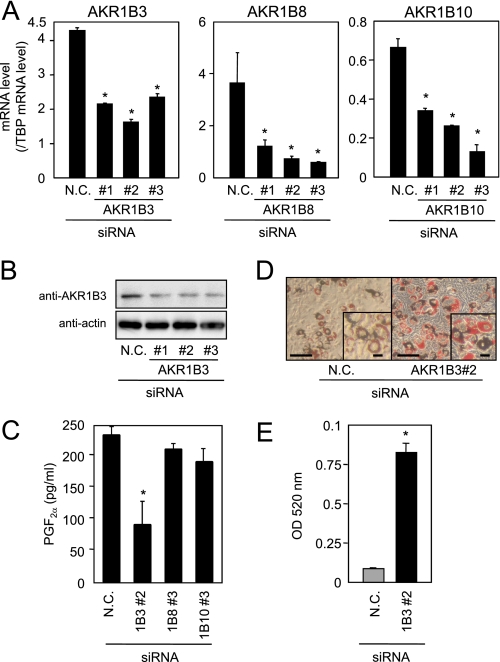
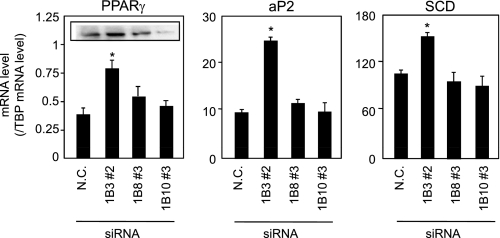
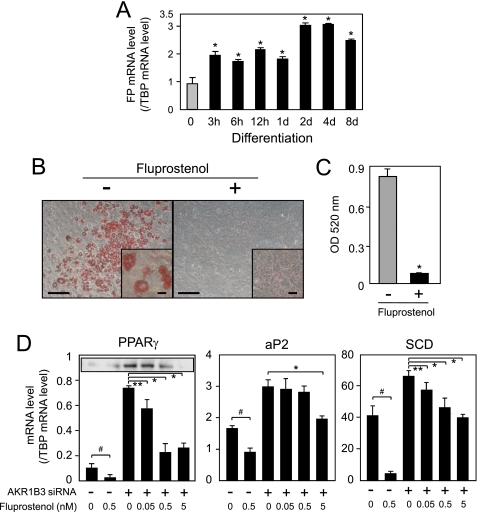
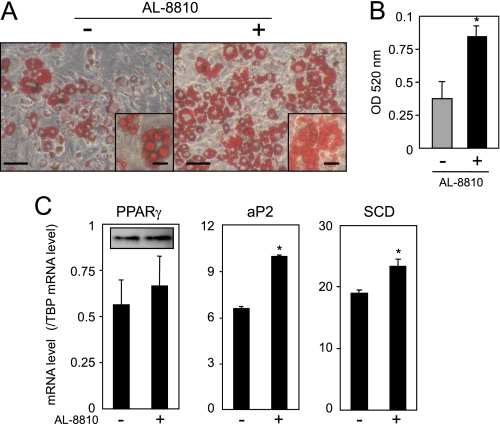
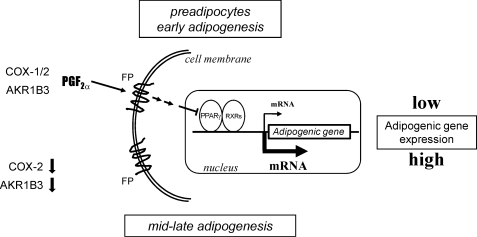
Prostaglandin (PG) F(2alpha) suppresses adipocyte differentiation by inhibiting the function of peroxisome proliferator-activated receptor gamma. However, PGF(2alpha) synthase (PGFS) in adipocytes remains to be identified. Here, we studied the expression of members of the aldo-keto reductase (AKR) 1B family acting as PGFS during adipogenesis of mouse 3T3-L1 cells. AKR1B3 mRNA was expressed in preadipocytes, and its level increased about 4-fold at day 1 after initiation of adipocyte differentiation, and then quickly decreased the following day to a level lower than that in the preadipocytes. In contrast, the mRNA levels of Akr1b8 and 1b10 were clearly lower than that level of Akr1b3 in preadipocytes and remained unchanged during adipogenesis. The transient increase in Akr1b3 during adipogenesis was also observed by Western blot analysis. The mRNA for the FP receptor, which is selective for PGF(2alpha), was also expressed in preadipocytes. Its level increased about 2-fold within 1 h after the initiation of adipocyte differentiation and was maintained at almost the same level throughout adipocyte differentiation. The small interfering RNA for Akr1b3, but not for Akr1b8 or 1b10, suppressed PGF(2alpha) production and enhanced the expression of adipogenic genes such as peroxisome proliferator-activated receptor gamma, fatty acid-binding protein 4 (aP2), and stearoyl-CoA desaturase. Moreover, an FP receptor agonist, Fluprostenol, suppressed the expression of those adipogenic genes in 3T3-L1 cells; whereas an FP receptor antagonist, AL-8810, efficiently inhibited the suppression of adipogenesis caused by the endogenous PGF(2alpha). These results indicate that AKR1B3 acts as the PGFS in adipocytes and that AKR1B3-produced PGF(2alpha) suppressed adipocyte differentiation by acting through FP receptors.
Figures
Similar articles
-
Prostaglandin F(2alpha) suppresses early phase of adipogenesis, but is not associated with osteoblastogenesis in mouse mesenchymal stem cells.Prostaglandins Other Lipid Mediat. 2010 Sep;93(1-2):52-9. doi: 10.1016/j.prostaglandins.2010.06.005. Epub 2010 Jun 30. Prostaglandins Other Lipid Mediat. 2010. PMID: 20601070
-
Synergistic suppression of early phase of adipogenesis by microsomal PGE synthase-1 (PTGES1)-produced PGE2 and aldo-keto reductase 1B3-produced PGF2α.PLoS One. 2012;7(9):e44698. doi: 10.1371/journal.pone.0044698. Epub 2012 Sep 7. PLoS One. 2012. PMID: 22970288 Free PMC article.
-
Aldose reductases influence prostaglandin F2α levels and adipocyte differentiation in male mouse and human species.Endocrinology. 2015 May;156(5):1671-84. doi: 10.1210/en.2014-1750. Epub 2015 Mar 2. Endocrinology. 2015. PMID: 25730106
-
Steroid hormone transforming aldo-keto reductases and cancer.Ann N Y Acad Sci. 2009 Feb;1155:33-42. doi: 10.1111/j.1749-6632.2009.03700.x. Ann N Y Acad Sci. 2009. PMID: 19250190 Free PMC article. Review.
-
Prostaglandin D2 and F2α as Regulators of Adipogenesis and Obesity.Biol Pharm Bull. 2022;45(8):985-991. doi: 10.1248/bpb.b22-00210. Biol Pharm Bull. 2022. PMID: 35908908 Review.
Cited by
-
Butein is a novel anti-adipogenic compound.J Lipid Res. 2013 May;54(5):1385-96. doi: 10.1194/jlr.M035576. Epub 2013 Mar 6. J Lipid Res. 2013. PMID: 23468131 Free PMC article.
-
Arachidonic Acid Added during the Differentiation Phase of 3T3-L1 Cells Exerts Anti-Adipogenic Effect by Reducing the Effects of Pro-Adipogenic Prostaglandins.Life (Basel). 2023 Jan 29;13(2):367. doi: 10.3390/life13020367. Life (Basel). 2023. PMID: 36836723 Free PMC article.
-
Prostaglandin (PG) F2 alpha synthesis in human subcutaneous and omental adipose tissue: modulation by inflammatory cytokines and role of the human aldose reductase AKR1B1.PLoS One. 2014 Mar 24;9(3):e90861. doi: 10.1371/journal.pone.0090861. eCollection 2014. PLoS One. 2014. PMID: 24663124 Free PMC article.
-
Hepatic xenobiotic metabolizing enzyme and transporter gene expression through the life stages of the mouse.PLoS One. 2011;6(9):e24381. doi: 10.1371/journal.pone.0024381. Epub 2011 Sep 8. PLoS One. 2011. PMID: 21931700 Free PMC article.
-
A new approach to detect small peptides clearly and sensitively by Western blotting using a vacuum-assisted detection method.Biophysics (Nagoya-shi). 2013 Jun 21;9:79-83. doi: 10.2142/biophysics.9.79. eCollection 2013. Biophysics (Nagoya-shi). 2013. PMID: 27493544 Free PMC article.
References
-
- Kershaw E. E., Flier J. S. (2004) J. Clin. Endocrinol. Metab. 89, 2548–2556 - PubMed
-
- Spiegelman B. M., Flier J. S. (2001) Cell 104, 531–543 - PubMed
-
- Evans R. M., Barish G. D., Wang Y. X. (2004) Nat. Med. 10, 355–361 - PubMed
-
- Berg A. H., Scherer P. E. (2005) Circ. Res. 96, 939–949 - PubMed
-
- Fujimori K., Aritake K., Urade Y. (2007) J. Biol. Chem. 282, 18458–18466 - PubMed
Publication types
MeSH terms
Substances
LinkOut - more resources
Full Text Sources
Research Materials
