. 2010 Mar 26;285(13):10110-10121.
doi: 10.1074/jbc.M109.089185. Epub 2010 Jan 21.

Gated access to the pore of a P2X receptor: structural implications for closed-open transitions

Affiliations

Gated access to the pore of a P2X receptor: structural implications for closed-open transitions

Sebastian Kracun et al. J Biol Chem. .

Abstract

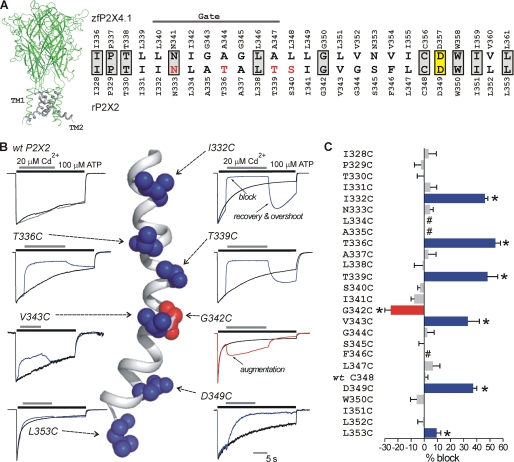
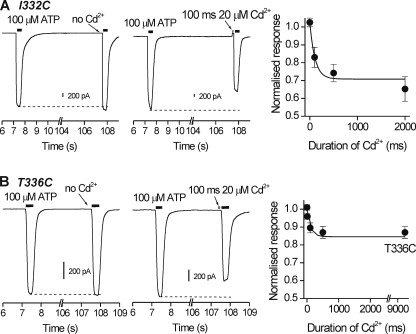
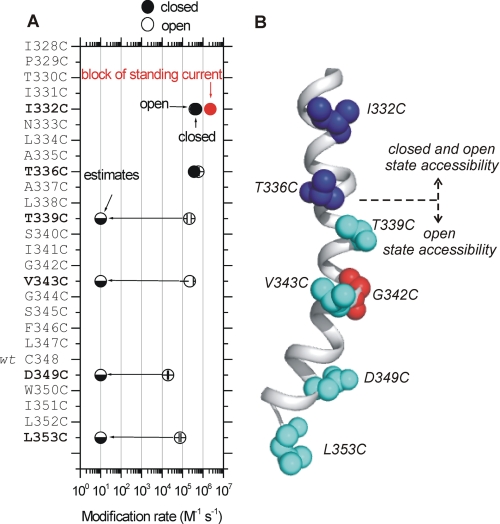
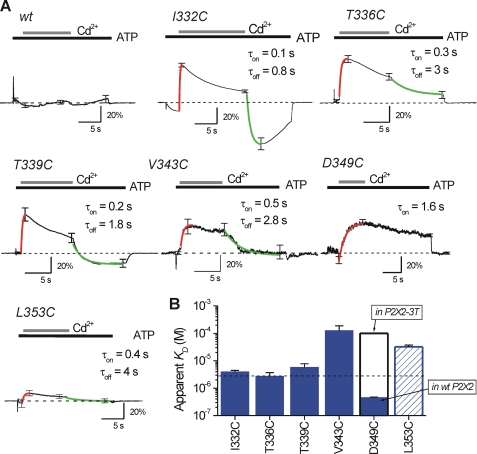
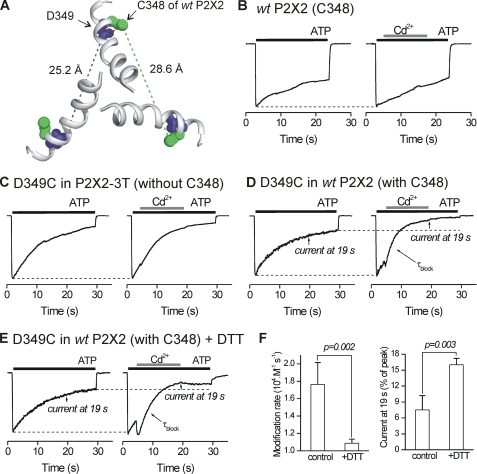
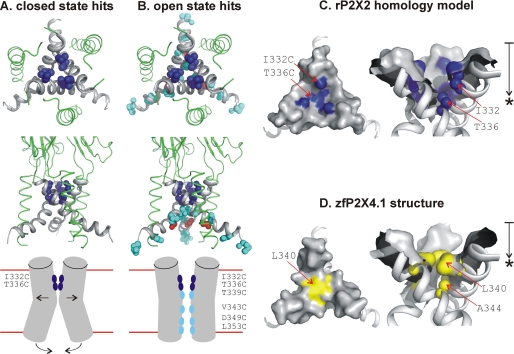
P2X receptors are ligand-gated cation channels that transition from closed to open states upon binding ATP. The crystal structure of the closed zebrafish P2X4.1 receptor directly reveals that the ion-conducting pathway is formed by three transmembrane domain 2 (TM2) alpha-helices, each being provided by the three subunits of the trimer. However, the transitions in TM2 that accompany channel opening are incompletely understood and remain unresolved. In this study, we quantified gated access to Cd(2+) at substituted cysteines in TM2 of P2X2 receptors in the open and closed states. Our data for the closed state are consistent with the zebrafish P2X4.1 structure, with isoleucines and threonines (Ile-332 and Thr-336) positioned one helical turn apart lining the channel wall on approach to the gate. Our data for the open state reveal gated access to deeper parts of the pore (Thr-339, Val-343, Asp-349, and Leu-353), suggesting the closed channel gate is between Thr-336 and Thr-339. We also found unexpected interactions between native Cys-348 and D349C that result in tight Cd(2+) binding deep within the intracellular vestibule in the open state. Interpreted with a P2X2 receptor structural model of the closed state, our data suggest that the channel gate opens near Thr-336/Thr-339 and is accompanied by movement of the pore-lining regions, which narrow toward the cytosolic end of TM2 in the open state. Such transitions would relieve the barrier to ion flow and render the intracellular vestibule less splayed during channel opening in the presence of ATP.


Figures

FIGURE 1.
FIGURE 1.
P2X2 receptor TM2 SCAM with Cd2+. A, view of a trimeric rP2X2 receptor homology model based on zfP2X4.1. The TM2 domains are shown in gray. The amino acid sequence alignment to the right shows TM2 for zfP2X4.1 and rP2X2. In this alignment, gray boxes indicate residues that are identical; yellow box shows the only residue in TM2 that is absolutely conserved across all species, with one known exception (see under “Discussion”); and the red residues are those thought to be involved in calcium selectivity (27, 28). The solid line labeled as Gate indicates the region thought to be responsible for the gate in the zfP2X4.1 closed state structure. B, normalized traces show control (100 μm ATP alone) and test traces (100 μm ATP followed by 20 μm Cd2+) for WT rP2X2 and the indicated cysteine mutants. The arrows point to the location of the native amino acids in TM2 on a closed state homology model of the rP2X2 receptor. C, average data for percentage block of ATP-evoked currents by Cd2+ for the amino acids indicated in TM2. Number sign indicates a nonfunctional cysteine mutant. Clear block was observed at I332C, T336C, T339C, V343C, D349C, and L353C. Augmentation of the current was observed at G342C. All the recordings were performed at −60 mV. Asterisks indicate significant differences (see text).
FIGURE 2.
FIGURE 2.
Closed state accessibility for I332C and T336C to Cd2+. A, traces for I332C mutants. The left-hand panel shows two responses evoked by 100 μm ATP applied ∼100 s apart. Note the responses were similar. The middle panel shows one control response and then a second test response to ATP that was preceded in this case by the application of 20 μm Cd2+ for 100 ms. Note that Cd2+ caused a slight outward current as it blocked the standing current for this mutant but also reduced the size of the subsequent ATP-evoked response. It is important to note that Cd2+ was removed from the bath 10 ms before ATP, i.e. was applied only to closed channels. The right-hand graph summarizes data from such experiments whereby Cd2+ was applied for differing durations before a test pulse of ATP. The line is a single exponential fit to the data. Such experiments were used to calculate the closed state modification rate for Cd2+ block (see text for further details). B, as in A but for T336C mutants. Note that in this case that Cd2+ did not cause any outward current because T336C mutants did not display any standing currents. All the recordings were performed at −60 mV.
FIGURE 3.
FIGURE 3.
Modification rates for Cd2+ block for cysteine mutants in TM2 of P2X2. A shows a plot for the rate of modification for cysteine mutants that were accessible in the open state (Fig. 1), which are indicated as open. The closed state modification rates are also shown for I332C and T336C (as shown in Fig. 2). For the other mutants, closed state reactivity could not be measured, as there was no detectable block of the ATP-evoked currents. In these cases, we estimate the closed state rates to be less than 10 m−1 s−1 (these values are shown as estimates with half-filled circles). As reported in the text, we measured significant standing currents for the I332C mutant that were blocked by the bath application of 20 μm Cd2+ (supplemental Fig. 1). The modification rate for block of the standing currents is also shown in this plot with a red symbol. In some cases the symbols are larger than the error bars in A and note that the x axis is logarithmic. B, schematic summarizing the data for mutants that were accessible in the closed and open states for P2X2. A switch in accessibility between closed and open states occurs between T336C and T339C. All the recordings were performed at −60 mV.
FIGURE 4.
FIGURE 4.
Traces used to assess reversibility and kinetics of Cd2+ block in TM2 of rP2X2. A shows average traces for current waveforms generated by subtracting control (ATP only) and test (ATP followed by ATP/Cd2+) records (as shown in Fig. 1). In the case of WT P2X2, the line was essentially flat as Cd2+ produced no block of ATP-evoked currents. In the other traces that are shown, clear current block is seen upon Cd2+ application that was reversible in all cases except D349C. The red lines are single exponential fits used to measure the time constant for Cd2+ block. The green traces are single exponential fits used to measure the time constant for Cd2+ dissociation. The time constants (τ) were used to measure the apparent affinity of Cd2+ (Kapp). B shows the Kapp values for each of the cysteine mutants that were significantly blocked by Cd2+ in the open state. The Cd2+ affinity was greatest for D349C as the block was irreversible (see text). This affinity was reduced in the P2X2-3T background (see text). All the recordings were performed at −60 mV.
FIGURE 5.
FIGURE 5.
Modification rates for Cd2+ block at single cysteine mutations in WT P2X2 and P2X2-3T receptors. The diagonal line is the line of identity between the x and y axis. The data for D349C deviate from this line because the modification rate for this residue in the P2X2-3T receptor background was minimal. The other indicated mutants sit close to the line of identity, suggesting that they behave similarly in WT P2X2 and P2X2-3T backgrounds. All the recordings were performed at −60 mV.
FIGURE 6.
FIGURE 6.
Interactions between native Cys-348 and D349C. A, extracellular view from above the membrane showing TM2 helices in the P2X2 pore and the positions of the native cysteine at Cys-348 in relation to the Asp-349 from three subunits. B, representative normalized control and test traces for WT P2X2. 100 μm ATP-evoked inward currents were not blocked by 20 μm Cd2+ (also see Fig. 1). C, as in B but for D349C mutants in the P2X2-3T background. D, as in B but with D349C mutants in the WT P2X2 background. Note the significant block by Cd2+ that exceeds that expected by desensitization alone (broken line). E, as in D but for cells that had been dialyzed with 10 mm DTT for 2–5 min. In this case the kinetics for Cd2+ block were considerably slower, and the degree of block was reduced. F, summary of experiments such as those shown in E for seven cells. The presence of DTT in the intracellular solution markedly reduced the modification rate and the percentage current block by 20 μm Cd2+. All the recordings were performed at −60 mV.
FIGURE 7.
FIGURE 7.
Summary of SCAM data for open and closed P2X2 receptors in relation to the closed state rP2X2 homology model. A, views of the membrane-spanning segment of rP2X2 based on the closed state homology model. The upper panel is a view from the extracellular side looking into the pore, and the middle panel is a view in the plane of the membrane. The residues highlighted in dark blue are Ile-332 and Thr-336, which displayed equally fast modification rates with Cd2+ in the closed and open states. The lower panel shows a schematic summary of the SCAM data for the closed state. For clarity, only two of three subunits are represented. B shows the open state hits highlighted on the closed state model of rP2X2 (upper and middle panels). The residues marked in cyan are T339C, V343C, D349C, and L353C, which displayed Cd2+ modification only in the open state. These were located deeper into the pore after the gate, which we propose is between Thr-336 and Thr-339. The lower panel is a schematic summary of the SCAM hits for the open state. Our data suggest that the open state of the rP2X2 receptor is associated with opening of the gate at Thr-336/Thr-339 and movements near the cytosolic end of the pore that render the TM2 helices significantly less splayed. For simplicity, G342C is not shown in the schematic but is represented in closed state homology model in red. C, surface representations of the extracellular vestibule for rP2X2 receptors. The region of approach to the gate is shown, as viewed from the extracellular side looking into the pore and in the plane of the membrane. The point of most occlusion is at Thr-336, which is consistent with the SCAM data (see B). The approximate distance between the top of TM2 and the point of maximum occlusion (*) at Thr-336 is 10 Å, as shown by the arrow. D, as in C but for the zfP2X4.1 structure. The point of most occlusion is at Leu-340 (*) and the approximate distance from the top of TM2 to this position is 6.5 Å.

Similar articles

Cited by

References

    1. Burnstock G. (2007) Physiol. Rev. 87, 659–797 - PubMed
    1. North R. A. (1996) CIBA Found. Symp. 198, 91–109 - PubMed
    1. Khakh B. S. (2001) Nat. Rev. Neurosci. 2, 165–174 - PubMed
    1. Khakh B. S., North R. A. (2006) Nature 442, 527–532 - PubMed
    1. Young M. T. (2010) Trends Biochem. Sci. 35, 83–90 - PMC - PubMed

Publication types

LinkOut - more resources