. 2010 Mar 26;285(13):10016-10029.
doi: 10.1074/jbc.M109.068759. Epub 2010 Jan 21.

Physical interaction of Jab1 with human serotonin 6 G-protein-coupled receptor and their possible roles in cell survival

Affiliations

Physical interaction of Jab1 with human serotonin 6 G-protein-coupled receptor and their possible roles in cell survival

Hyung-Mun Yun et al. J Biol Chem. .

Abstract

The 5-HT(6) receptor (5-HT(6)R) is one of the most recently cloned serotonin receptors, and it plays important roles in Alzheimer disease, depression, and learning and memory disorders. However, unlike the other serotonin receptors, the cellular mechanisms of 5-HT(6)R are poorly elucidated relative to its significance in human brain diseases. Here, using a yeast two-hybrid assay, we found that the human 5-HT(6)R interacts with Jun activation domain-binding protein-1 (Jab1). We also confirmed a physical interaction between 5-HT(6)R and Jab1 using glutathione S-transferase pulldown, fluorescence resonance energy transfer, co-immunoprecipitation, and immunocyto(histo)chemistry assays. The manipulation of Jab1 expression using Jab1 small interference RNA decreased 5-HT(6)R-mediated activity and cell membrane expression of 5-HT(6)R, whereas overexpression of Jab1 produced no significant effect. In addition, we demonstrated that the activation of 5-HT(6)R induced the translocation of Jab1 into the nucleus and increased c-Jun phosphorylation and the interaction between Jab1 and c-Jun. Furthermore, we found that 5-HT(6)R and Jab1 were up-regulated in middle cerebral artery occlusion-induced focal cerebral ischemic rats and in cultured cells exposed to hypoxic insults, suggesting possible protective roles for 5-HT(6)R and Jab1. These findings suggest that Jab1 provides a novel signal transduction pathway for 5-HT(6)R and may play an important role in 5-HT(6)R-mediated behavior changes in the brain.


Figures

FIGURE 1.
FIGURE 1.
Specific interaction between Jab1 and human 5-HT6R identified using GST pulldown and co-immunoprecipitation assays. A, left, schematic diagrams showing GαS-family GPCR 5-HT6R characterized by seven helical transmembrane domains; right, schematic diagrams showing iL2 (intracellular loop 2), iL3 (intracellular loop 3), and CT (C terminus) of 5-HT6R as bait and Jab1 protein as prey. NT-Jab1 and CT-Jab1 represent two fragments of Jab1, amino acids 1–151 and 152–334, respectively. B, immobilized GST, GST-iL2, GST-iL3, or GST-CT was incubated with purified full-length His-tagged Jab1, and then the retained proteins were analyzed with anti-His6 or anti-GST antibodies. C, immobilized GST, GST-iL3, or GST-CT was incubated with NT-Jab1 or CT-Jab1, and then the retained proteins were analyzed with anti-His6 or anti-GST antibodies. D, CHO/K-1 cells were transfected with FLAG-Jab1. After 24 h, the cells were lysed, and the lysates were incubated with immobilized GST, GST-iL3, or GST-CT. The retained proteins were analyzed by immunoblotting with anti-Jab1 or anti-GST antibodies. E, purified GST, GST-iL3, or GST-CT was immobilized and incubated with whole rat brain lysates. The retained proteins were detected with anti-Jab1 or anti-GST antibodies. F, HEK293 cells were transfected with HA-5-HT6R. After 24 h, immunoprecipitation was carried out using anti-HA or anti-Jab1 antibodies. The immune complexes were then analyzed by immunoblotting with anti-HA or anti-Jab1 antibodies. Proper expression of transiently transfected HA-5-HT6R and endogenous Jab1 in cell lysates was identified with specific antibodies. G, the rat brain lysates were immunoprecipitated with anti-rabbit IgG, anti-5-HT6R, and anti-Jab1 antibodies. The immune complexes and the brain lysates were analyzed by immunoblotting with anti-Jab1 antibodies.
FIGURE 2.
FIGURE 2.
Jab1 shows co-localization with human 5-HT6R in diverse cells and similar distribution with 5-HT6R in the rat brain. A, HEK293 cells were transfected with eCFP/eYFP or eCFP-Jab1/5-HT6R-eYFP. After 24 h, the cells were fixed and then eCFP, eYFP, eCFP-Jab1, or 5-HT6R-eYFP fluorescence was monitored. The pseudocolor for visualization of fluorescence intensity represents FRET efficiency calculated as FRET/eCFP ratio. B, HEK293 cells were transfected with eCFP-Jab1 and 5-HT6R-eYFP. After 24 h, the cells were fixed, and eCFP-Jab1 or 5-HT6R-eYFP fluorescence was monitored. Fluorescence intensity was visualized using pseudocolor, and the bleached region is indicated by a circle. C, immunofluorescence analysis in HEK293 cells, CHO/K-1 cells, and cultured rat hippocampal neurons. HEK293 and CHO/K-1 cells were transfected with HA-5-HT6R. After 24 h of transfection, the cells were fixed and permeabilized. HA-5-HT6R (green) was immunostained with rabbit anti-HA followed by fluorescein isothiocyanate-conjugated secondary antibodies, and Jab1 (red) was immunostained with mouse anti-Jab1, followed by rhodamine-conjugated secondary antibodies. In cultured rat hippocampal neurons, endogenous 5-HT6R (green) was immunostained with rabbit anti-5-HT6R, followed by fluorescein isothiocyanate-conjugated secondary antibodies. The third panels show the merged images of the first and second panels. Negative control experiments (CON) were processed with only fluorescein isothiocyanate- and rhodamine-conjugated IgG antibodies. D, immunohistochemical assay showing regional distribution of 5-HT6R and Jab1. Coronal sections of adult rat brains were immunostained with rabbit anti-5-HT6R and mouse anti-Jab1 antibodies. The third panels show magnified images of the hippocampus. Negative control experiments (CON) were processed with only horseradish peroxidase-conjugated rabbit or mouse IgG antibodies.
FIGURE 3.
FIGURE 3.
The expression level of Jab1 tightly regulates the activity of 5-HT6R. A, HEK293 cells were transiently transfected with 5-HT6R and Gα15 in the presence of FLAG-vector (open circles) or FLAG-Jab1 (closed circles) for 24 h. The Ca2+ responses by 10 μm 5-HT were measured using an FDSS6000 system. F is the fluorescence intensity, and F0 is the initial fluorescence intensity at 480 nm. Inset, pooled results showing the mean relative change of the ratio (F/F0) measured at the indicated time (#). The mean relative change of ratio by Jab1 was 105.4 ± 1.8% of the control (n = 4, p = 0.07). B, dose-response relationship of 5-HT6R-mediated Ca2+ responses in the absence (open circles) and in the presence (closed circles) of Jab1 overexpression. Best-fit lines were computed for all concentration-response curves using the equation, y/ymax = 1/(1 + (k½/[5-HT])nH), where ymax is the maximum response, ½ is the concentration for half-maximum response (EC50), and nH is the Hill coefficient. Intracellular Ca2+ changes are expressed as a percentage of the maximum response obtained at a 10 μm concentration of 5-HT. C, the changes in intracellular Ca2+ mediated by 10 μm 5-HT in 5-HT6R- and Gα15-transfected HEK293 cells in the absence (open circles) and in the presence (closed circles) of Fyn overexpression were recorded using an FDSS6000 system. The mean relative change in the ratio mediated by Fyn was 156.5 ± 3.7% of the control (n = 4; ***, p < 0.001). D, the changes in intracellular Ca2+ mediated by 10 μm 5-HT in 5-HT6R- and Gα15-transfected HEK293 cells with negative control siRNA (open circles) or with Jab1 siRNA (closed circles) were recorded using an FDSS6000 system. The mean relative change of ratio following treatment with Jab1 siRNA was 69.3 ± 1.0% of the control (n = 4; ***, p < 0.001). E, dose-response relationship of 5-HT6R-mediated Ca2+ responses with negative control siRNA (open circles) or with Jab1 siRNA. The changes in Ca2+ responses are expressed as a percentage of the maximum response observed with a 10 μm concentration of 5-HT. F, the expression level of Jab1 after transfecting with Jab1 siRNA was confirmed by immunoblotting using an anti-Jab1 antibody. β-Tubulin was detected by immunoblotting on the same sample to normalize the amount of lysates. ***, p < 0.001 compared with control.
FIGURE 4.
FIGURE 4.
Jab1 modulates the expression levels of 5-HT6R by regulating stability of 5-HT6R. After HEK/HA-5-HT6R cells were transiently transfected with negative control siRNA or Jab1 siRNA in A and with FLAG-vector or FLAG-Jab1 in B for 24 h, the total expression level of 5-HT6R was analyzed by immunoblotting cell lysates. Representative immunoblotting results were detected using anti-HA, anti-Jab1, and anti-β-tubulin antibodies. **, p < 0.01 compared with control. After HEK/HA-5-HT6R cells were transiently transfected with negative control siRNA or Jab1 siRNA in C and with FLAG-vector or FLAG-Jab1 in D for 24 h, cycloheximide (CHX) was added at 100 μg/ml. Then total proteins were isolated at 0, 1, 3, and 6 h after CHX treatment. The expression level of 5-HT6R was analyzed by immunoblotting. Representative immunoblotting results were detected using anti-HA, anti-Jab1, and anti-β-tubulin antibodies. The data are represented as relative percentages of the control. **, p < 0.01; ***, p < 0.001 compared with control. E, HEK293 cells were transiently transfected with 5-HT6R-eGFP and negative control siRNA-cy3 or with 5-HT6R-eGFP and Jab1 siRNA-cy3 for 24 h. After the cells were fixed, eGFP fluorescence was excited (Ex: 488 nm) and detected (Em: 507 nm). Cy3 fluorescence showed that negative control siRNA and Jab1 siRNA were transfected in HEK293 cells. F, magnified images of HEK293 cells transfected with 5-HT6R-eGFP and negative control siRNA-cy3 (left, blue color) or with 5-HT6R-eGFP and Jab1 siRNA-cy3 (right, red color) are marked with arrows in E. The graph shows pixel-by-pixel fluorescence intensity measured along the line drawn across the cells.
FIGURE 5.
FIGURE 5.
The activation of 5-HT6R affects the Jab1 distribution and the interaction with c-Jun or 5-HT6R. A, after CHO/5-HT6R cells were treated with 20 μm 5-HT for 60 min, the cells were fixed and permeabilized. Jab1 (red) and β-tubulin (green) were stained using mouse anti-Jab1 and rabbit anti-β-tubulin antibodies. Fluorescence of these proteins was visualized with cy5.5-conjugated and fluorescein isothiocyanate-conjugated secondary antibodies, respectively. B, after CHO/5-HT6R cells were treated with 20 μm 5-HT for the indicated times, the Jab1 contents were analyzed by immunoblotting with anti-Jab1 in separated cytoplasmic or nuclear fractions. β-Tubulin and histone H3 were used as cytoplasmic and nuclear markers, respectively. C, the cells were treated with 20 μm 5-HT for the indicated times and were assayed to detect phospho-c-Jun (p-c-Jun) and c-Jun. Representative immunoblotting results were analyzed by using anti-phospho-c-Jun (p-c-Jun), anti-c-Jun, and anti-β-tubulin antibodies. D, under the same experimental conditions, the cell lysates were immunoprecipitated with anti-Jab1 antibodies, and the immunocomplexes were assayed using anti-Jab1 and anti-c-Jun antibodies. Proper expression of endogenous Jab1 and c-Jun in cell lysates was identified with specific antibodies. The data shown in the bar graph were normalized as relative percentages of the control (no treatment with 5-HT). *, p < 0.05 compared with control. E, HEK293 cells were transiently transfected with Myc-vector or Myc-5-HT6R, treated with 20 μm 5-HT for 30 min, and then immunoprecipitated with anti-Myc or anti-Jab1 antibodies. The immunocomplexes were then analyzed by immunoblotting with anti-Myc or anti-Jab1 antibodies. The proper expression of transiently transfected or endogenous protein in cell lysates was identified with the specific antibodies.
FIGURE 6.
FIGURE 6.
The increased expression levels of 5-HT6R and Jab1 in a rat model of focal cerebral ischemia. Rats subjected to MCAO for 2 h were reperfused for 1 day. A, coronal sections of the rat brain were stained with cresyl violet (left) or immunostained with anti-5-HT6R (middle) or anti-Jab1 antibodies (right). B, the bar graph represents the density of cresyl violet staining (B1) and the quantification of the expression of 5-HT6R (B2) and Jab1 (B3) in the cortex and striatum. The data shown in the bar graph were normalized as relative percentages of the ipsilateral undamaged control area (CON). *, p < 0.05; **, p < 0.01; and ***, p < 0.001 compared with control.
FIGURE 7.
FIGURE 7.
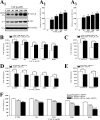
The presence of 5-HT6R with Jab1 increases cell survival under hypoxia. A, the HEK/HA-5-HT6R cells were treated with the indicated CoCl2 dose for 6 h and then were allowed to recover for 12 h before being analyzed. A1, representative immunoblotting was detected using anti-HA, anti-Jab1, and anti-β-tubulin antibodies. A2 and A3, the data shown in the bar graphs were normalized as relative percentages of the control. The viability of cells exposed to various doses of CoCl2 or OGD conditions (5% CO2, 10% H2, and 85% N2 in a glucose-free solution) for 6 h was measured using an 3-(4,5-dimethylthiazol-2-yl)-2,5-diphenyltetrazolium bromide assay after recovery in normal Dulbecco's modified Eagle's medium culture media for 12 h. Native HEK293 and HEK/HA-5-HT6R cells were used in B and C, HEK/HA-5-HT6R cells transfected with Jab1 siRNA or negative control siRNA were used in D and E, and HEK/HA-5-HT6R cells transfected with 5-HT6R siRNA, 5-HT6R siRNA·Jab1 siRNA, or negative control siRNA were used in F. The data are represented as relative percentages of the control. *, p < 0.05; **, p < 0.01; and ***, p < 0.001 compared with control.
FIGURE 8.
FIGURE 8.
Primary amino acid alignment of h5-HT6R, rLHR, and hPAR-2, which interact with Jab1. A, the intracellular loop 3 (iL3) of human 5-HT6R (h5-HT6R; 209–265 region) was aligned to the iL3 region of rat LHR (rLHR; 552–574 region) and to human PAR-2 (hPAR-2; 261–285 region). B, the C-terminal (CT) region of h5-HT6R (321–440 region) was aligned to the CT of rLHR (632–700 region) and hPAR-2 (348–397 region). An arrow indicates the starting point of rLHR previously aligned with human p27 and human c-Jun, which interact with Jab1 (Li, et al. (36)). The primary amino acid alignment as shown in A and B was obtained using the ClustalW2 program. Identical or homologous residues are shaded in dark or light gray, respectively. Gaps introduced for optimal alignment are represented by dashes. Identical sequences in at least two of the three sequences are represented by bold characters, and homologous residues are indicated by dots at the bottom.

Similar articles

Cited by

References

    1. Svenningsson P., Tzavara E. T., Liu F., Fienberg A. A., Nomikos G. G., Greengard P. (2002) Proc. Natl. Acad. Sci. U.S.A. 99, 3188–3193 - PMC - PubMed
    1. Barnes N. M., Sharp T. (1999) Neuropharmacology 38, 1083–1152 - PubMed
    1. Kohen R., Metcalf M. A., Khan N., Druck T., Huebner K., Lachowicz J. E., Meltzer H. Y., Sibley D. R., Roth B. L., Hamblin M. W. (1996) J. Neurochem. 66, 47–56 - PubMed
    1. Ward R. P., Hamblin M. W., Lachowicz J. E., Hoffman B. J., Sibley D. R., Dorsa D. M. (1995) Neuroscience 64, 1105–1111 - PubMed
    1. Roth B. L., Craigo S. C., Choudhary M. S., Uluer A., Monsma F. J., Jr., Shen Y., Meltzer H. Y., Sibley D. R. (1994) J. Pharmacol. Exp. Ther. 268, 1403–1410 - PubMed

Publication types