. 2010 Jun;27(6):1289-300.
doi: 10.1093/molbev/msq014. Epub 2010 Jan 21.

Performance of relaxed-clock methods in estimating evolutionary divergence times and their credibility intervals

Affiliations

Performance of relaxed-clock methods in estimating evolutionary divergence times and their credibility intervals

Fabia U Battistuzzi et al. Mol Biol Evol. 2010 Jun.

Abstract

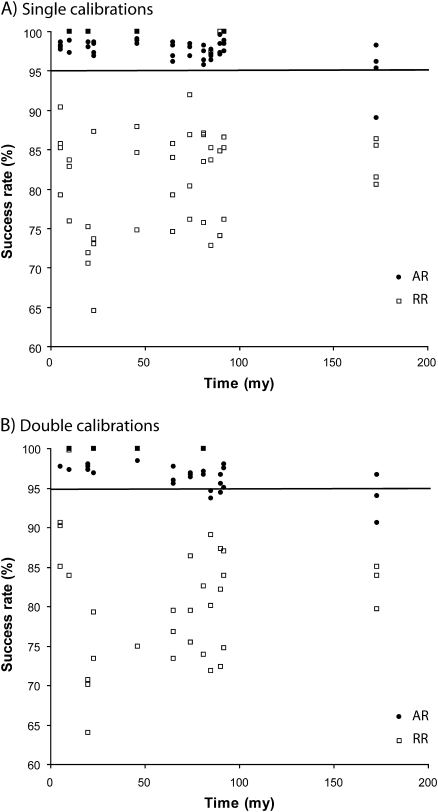
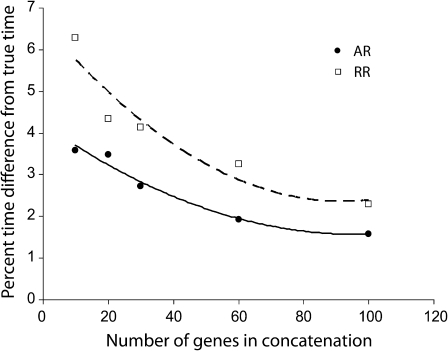
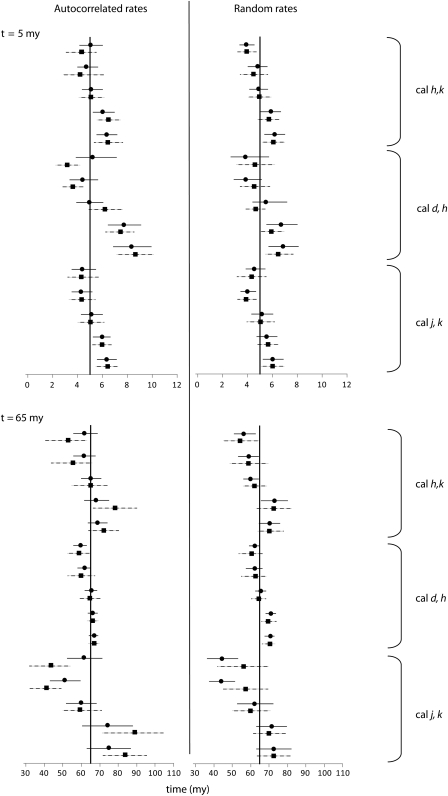
The rapid expansion of sequence data and the development of statistical approaches that embrace varying evolutionary rates among lineages have encouraged many more investigators to use DNA and protein data to time species divergences. Here, we report results from a systematic evaluation, by means of computer simulation, of the performance of two frequently used relaxed-clock methods for estimating these times and their credibility intervals (CrIs). These relaxed-clock methods allow rates to vary in a phylogeny randomly over lineages (e.g., BEAST software) and in autocorrelated fashion (e.g., MultiDivTime software). We applied these methods for analyzing sequence data sets simulated using naturally derived parameters (evolutionary rates, sequence lengths, and base substitution patterns) and assuming that clock calibrations are known without error. We find that the estimated times are, on average, close to the true times as long as the assumed model of lineage rate changes matches the actual model. The 95% CrIs also contain the true time for >or=95% of the simulated data sets. However, the use of incorrect lineage rate model reduces this frequency to 83%, indicating that the relaxed-clock methods are not robust to the violation of underlying lineage rate model. Because these rate models are rarely known a priori and are difficult to detect empirically, we suggest building composite CrIs using CrIs produced from MultiDivTime and BEAST analysis. These composite CrIs are found to contain the true time for >or=97% data sets. Our analyses also verify the usefulness of the common practice of interpreting the congruence of times inferred from different methods as a reflection of the accuracy of time estimates. Overall, our results show that simple strategies can be used to enhance our ability to estimate times and their CrIs when using the relaxed-clock methods.


Figures

F<sc>IG</sc>. 1.
FIG. 1.
The model timetree used in computer simulations. The internal nodes are labeled al, with node a being the ingroup root node. Extant taxa are A through M plus the outgroup (out). True times for each internal node are as follows: a: 173 Myr, b: 92 Myr, c: 90 Myr, d: 81 Myr, e: 85 Myr, f: 65 Myr, g: 74 Myr, h: 46 Myr, i: 20 Myr, j: 23 Myr, k: 10 Myr, and l: 5 Myr.
F<sc>IG</sc>. 2.
FIG. 2.
Distributions of single gene time estimates obtained from MultiDivTime analysis of autocorrelated sequences. Results for four nodes are shown for a subset of single and double calibrations. Vertical dotted lines mark the true time, with the arrows indicating the mean of the inferred time distributions Cal, calibration.
F<sc>IG</sc>. 3.
FIG. 3.
Comparison of the size of the CrIs from single and double calibrations (A) and the percent cases in which the CrI contained the true time (B). All results are for the MultiDivTime analysis of autocorrelated sequences. In panel A, all values for each node are averages over 3,136 replicates and calibration points. In panel B, for each node, there are seven success rates (percentage of replicates for which the CrI contains the true time), which correspond to seven calibration sets and 448 replicates. In some cases, less than seven results are visible because of overlapping points. The horizontal line marks the 95% threshold, which is the expected value because we constructed 95% CrIs. All success rate values below 95% are circled with letters referring to nodes in Fig. 1.
F<sc>IG</sc>. 4.
FIG. 4.
The relative success rates of CrIs in containing the true time when using MultiDivTime for the analysis of AR and RR simulated sequences using single (A) and double (B) calibrations . The horizontal line marks the 95% threshold.
F<sc>IG</sc>. 5.
FIG. 5.
Increased accuracy of times inferred from ten-gene concatenations (thick line) compared with those from single genes (thin line). A total of 100 ten-gene concatenations and 448 single genes were analyzed. RR sequences showed patterns similar to the ARs (presented here). The percent time difference is given by ([estimated time − true time]/true time) and is estimated for each replicate independently. MultiDivTime results from single genes (thinner line) and from concatenations (bolded line) are shown for AR simulations. For a comparison, see figure 2 for the distribution of actual time estimates for the nodes and calibrations for which results are shown here.
F<sc>IG</sc>. 6.
FIG. 6.
The effect of increasing number of genes on the difference between estimated and true times. Each data point is the average percent time difference obtained for all nodes using double calibrations with MultiDivTime. Filled circles, autocorrelated simulated sequences; empty squares, RR simulated sequences. A second-order polynomial fits the data (R2 = 0.97 for AR sequences and 0.90 for RR sequences).
F<sc>IG</sc>. 7.
FIG. 7.
Nodes and calibration combinations yielding CrIs with success rates ≥95% (open circles) and <95% (filled circles). All analyses were conducted by using MultiDivTime on autocorrelated sequences. Cal, calibration.
F<sc>IG</sc>. 8.
FIG. 8.
A comparison of time estimates and CrIs produced by MultiDivTime (filled circles, with solid line) and BEAST (filled squares, with dotted line), for example, nodes. Each point (black symbol) and the associated 95% CrI are shown for five 10-gene concatenation data sets when using different sets of calibrations.

References

    1. Ayala FJ. Molecular clock mirages. Bioessays. 1999;21:71–75. - PubMed
    1. Benton MJ, Ayala FJ. Dating the tree of life. Science. 2003;300:1698–1700. - PubMed
    1. Benton MJ, Donoghue PCJ, Asher RJ. Calibrating and constraining the molecular clock. In: Hedges SB, Kumar S, editors. The timetree of life. New York: Oxford University Press; 2009.
    1. Blair JE, Hedges SB. Molecular clocks do not support the Cambrian explosion. Mol Biol Evol. 2005;22:387–390. - PubMed
    1. Brocks JJ, Pearson A. Building the biomarker tree of life. Rev Mineral Geochem. 2005;59:233–258.

Publication types