. 2010 Mar;176(3):1364-76.
doi: 10.2353/ajpath.2010.090647. Epub 2010 Jan 21.

Enhanced metabolic flexibility associated with elevated adiponectin levels

Affiliations

Enhanced metabolic flexibility associated with elevated adiponectin levels

Ingrid Wernstedt Asterholm et al. Am J Pathol. 2010 Mar.

Abstract

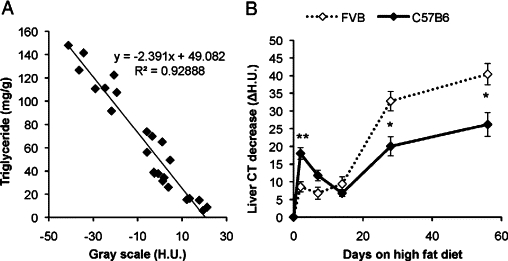
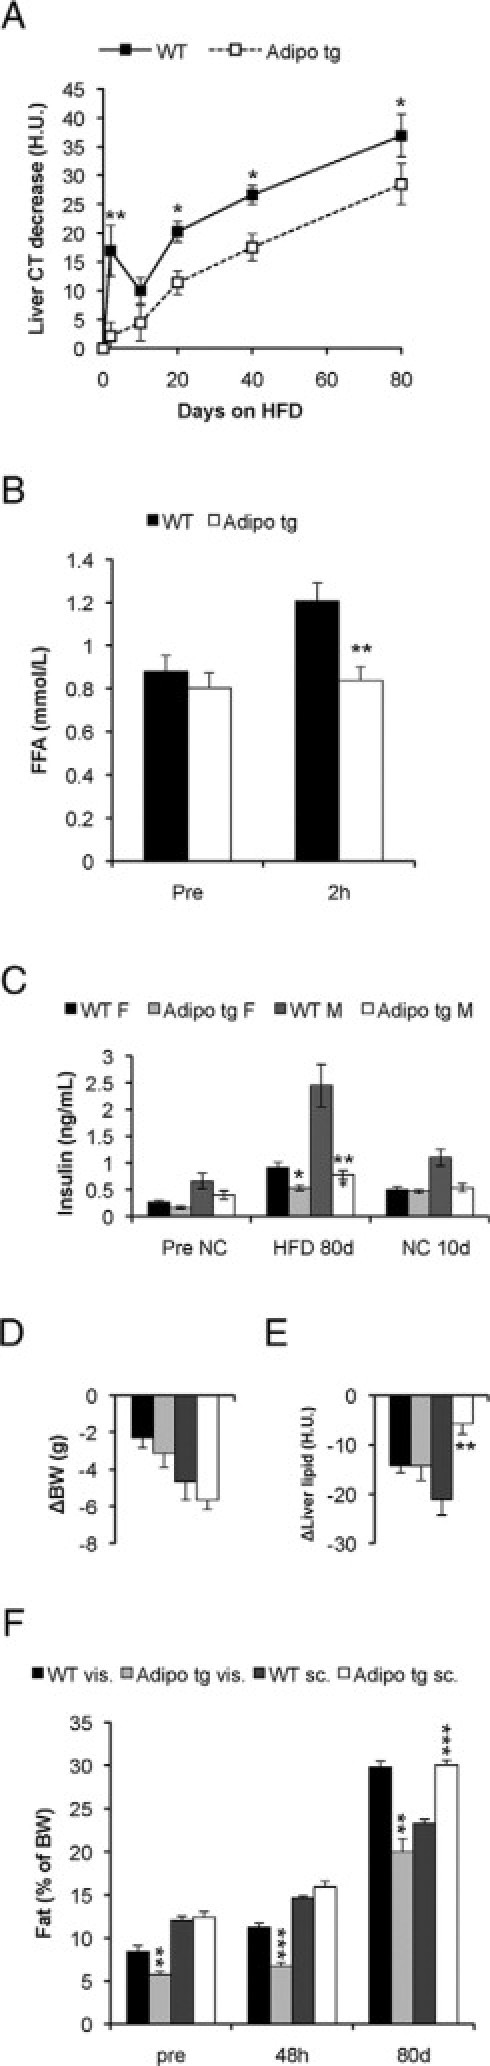
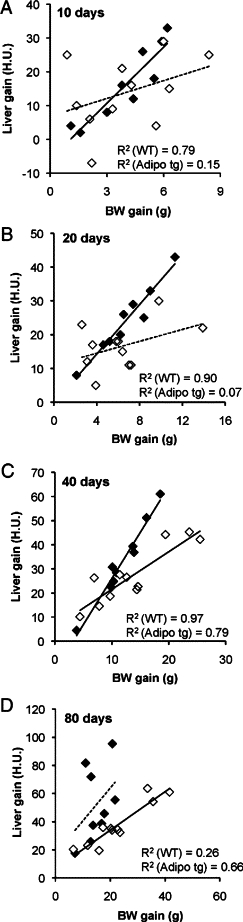
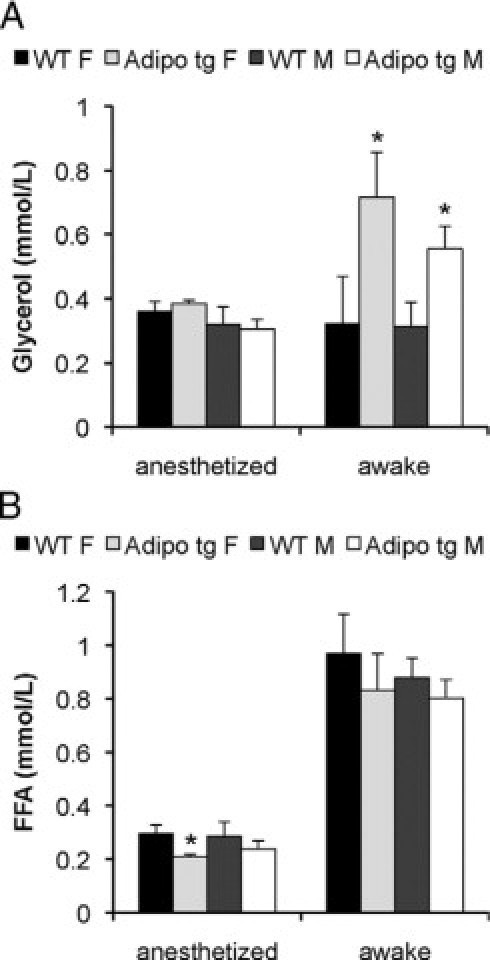
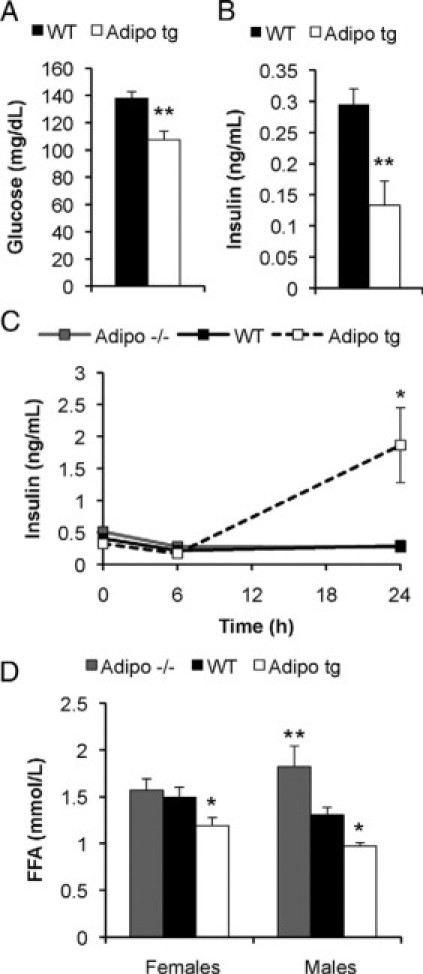
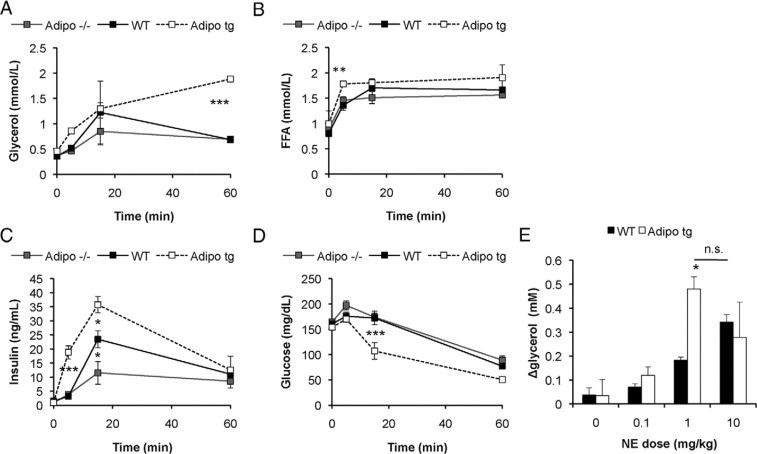
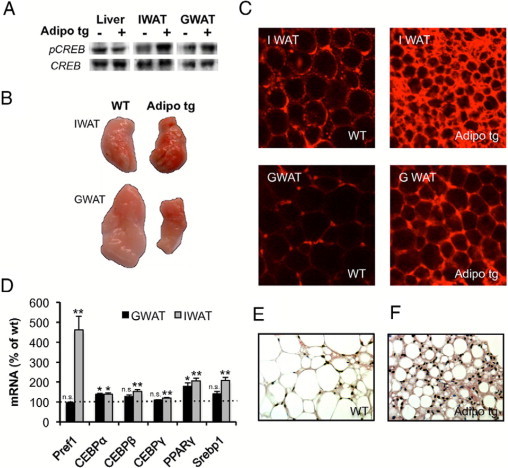
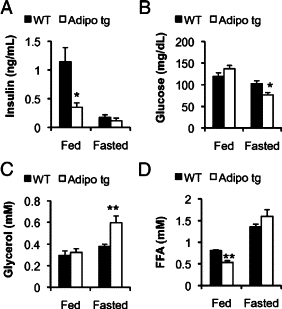
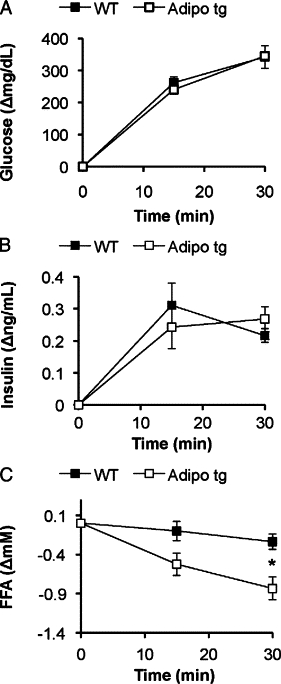
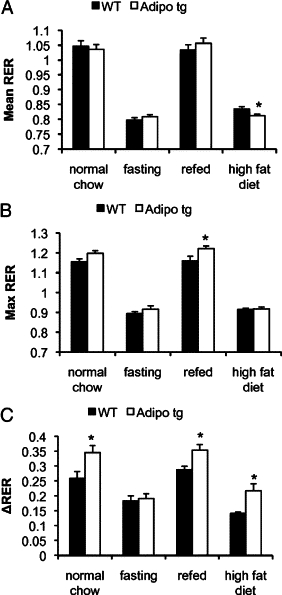
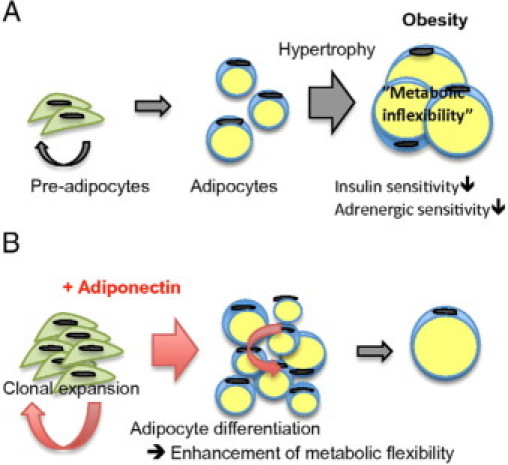
Metabolically healthy individuals effectively adapt to changes in nutritional state. Here, we focus on the effects of the adipocyte-derived secretory molecule adiponectin on adipose tissue in mouse models with genetically altered adiponectin levels. We found that higher adiponectin levels increased sensitivity to the lipolytic effects of adrenergic receptor agonists. In parallel, adiponectin-overexpressing mice also display enhanced clearance of circulating fatty acids and increased expansion of subcutaneous adipose tissue with chronic high fat diet (HFD) feeding. These adaptive changes to the HFD were associated with increased mitochondrial density in adipocytes, smaller adipocyte size, and a general transcriptional up-regulation of factors involved in lipid storage through efficient esterification of free fatty acids. The physiological response to adiponectin overexpression resembles in many ways the effects of chronic exposure to beta3-adrenergic agonist treatment, which also results in improvements in insulin sensitivity. In addition, using a novel computed tomography-based method for measurements of hepatic lipids, we resolved the temporal events taking place in the liver in response to acute HFD exposure in both wild-type and adiponectin-overexpressing mice. Increased levels of adiponectin potently protect against HFD-induced hepatic lipid accumulation and preserve insulin sensitivity. Given these profound effects of adiponectin, we propose that adiponectin is a factor that increases the metabolic flexibility of adipose tissue, enhancing its ability to maintain proper function under metabolically challenging conditions.


Figures

Figure 1
Figure 1
A: Liver lipid content was measured with CT analysis and with conventional biochemical extraction and analysis of triglycerides. There was a significant negative correlation between H.U. and extracted triglycerides (n = 24). B: Using our CT-based method, liver lipid content was followed in HFD-fed female FVB and C57B6 mice. Liver lipids are expressed as H.U. (baseline) − H.U. (HFD); thus, an increase in lipid content will result in a positive ΔH.U. value. n = 5 + 5. *P < 0.05; **P < 0.01 for C57B6 versus FVB mice.
Figure 2
Figure 2
Liver lipid content (A) and fat distribution (F) was estimated with CT analysis in HFD-fed adipo tg and littermate control male C57B6 mice (WT). The measurements were performed at 9 AM to 12 PM with the mice having free access to food. After 80 days consuming the HFD these mice were again fed normal chow (NC). vis., visceral adipose tissue; sc, subcutaneous adipose tissue. C: Serum insulin levels were analyzed in samples drawn before the HFD, after 80 days of consuming the HFD and 10 days after the reintroduction of normal chow. F, female; M, male. Weight (BW) (D) and liver lipid change (E) after the reintroduction of normal chow are shown. Another set of male C57B6 mice was given olive oil orally (10 μl/g mouse) to assess triglyceride clearance. Serum free fatty acids were analyzed before and after 2 hours after the lipid load (B). n = 4 to 6/group. *P < 0.05; **P < 0.01 for adipo tg versus WT mice.
Figure 3
Figure 3
Body weight (BW) gain is plotted against liver lipid gain after 10 (A), 20 (B), 40 (C), and 80 (D) days on HFD using both male and female C57B6 adipo tg (white squares) and littermate control mice (black squares). – – –, nonsignificant trend; ——, significant correlation.
Figure 4
Figure 4
Serum glycerol (A) and free fatty acid (B) levels were measured in awake and chloral hydrate-anesthetized male (M) and female (F) C57B6 adipo tg and littermate control mice. n = 5 to 7/group. *P < 0.05.
Figure 5
Figure 5
Serum glucose (A) and insulin levels (B) in male C57B6 adipo tg and littermate control mice after a 5-hour fast. n = 5 + 5. *P < 0.05 for WT versus adipo tg. Serum insulin levels (C) in female FVB adipo tg, adipo−/−, and control mice after a 0-, 6-, and 24-hour fast and serum free fatty acid levels (D) in awake FVB adipo tg, adipo−/−, and control mice. n = 4 to 6/group. *P < 0.05; **P < 0.01 for WT versus adipo tg; in C, *P < 0.05 for WT versus adipo−/− mice; in D, **P < 0.05 for 24-hour fasted versus fed adipo tg mice.
Figure 6
Figure 6
Female FVB adipo tg, adipo−/−, and control (WT) mice were injected with β3AR-agonist (1 mg/kg CL 316,243 i.p.), and serum levels of glycerol (A), FFA (B), insulin (C), and glucose (D) were measured in tail vein samples after 0, 5, 16, and 60 minutes. n = 4 to 6/group. *P < 0.05; **P < 0.01; ***P < 0.001 for WT versus adipo tg mice; $P < 0.05 for WT versus adipo−/− mice. E: Increase in serum glycerol levels 15 minutes after norepinephrine (NE) i.p. injection at the indicated dose. n = 2 to 5/dose and group. *P < 0.05 for WT versus adipo tg.
Figure 7
Figure 7
A: Western blot analysis for total and phosphorylated CREB protein in liver, inguinal (IWAT) and gonadal adipose tissue (GWAT). B: Whole fat pads stained with 1% 2,3,5-triphenyltetrazoliumchloride to assess electron transport activity. C: Fat pad minces stained with MitoTracker Orange. D: Regulation of genes involved in adipogenesis in inguinal and gonadal adipose tissue of adipo tg mice. Gene expression data were obtained with DNA array analysis and are expressed as a percentage of wild-type littermate controls (ie, 100% indicates no change in expression compared with controls). *P < 0.05; **P < 0.01 for WT versus adipo tg mice. E and F: Representative examples of H&E-stained IWAT. All data presented in this figure were obtained in male C57B6 adipo tg with littermate wild-type control mice. Pref1, preadipocyte factor 1; Srebp1, sterol regulatory element binding transcription factor 1.
Figure 8
Figure 8
Serum insulin (A), glucose (B), glycerol (C), and FFA (D) levels in the fed state at the dark phase and after a 24-hour fast in female adipo tg FVB and littermate wild-type control mice. n = 4 + 5. *P < 0.05; **P < 0.01 for WT versus adipo tg.
Figure 9
Figure 9
Change in serum glucose (A), insulin (B), and FFA (C) after an oral load of glucose (2.5 g/kg) to 24-hour fasted mice. n = 4 + 5. *P < 0.05 for WT versus adipo tg mice.
Figure 10
Figure 10
RER analysis of data obtained from female adipo tg C57B6 and littermate wild-type controls fed normal chow, during a fast, on the second day after refeeding and on the second day after the switch form normal chow to the HFD. The average (mean RER, A), the average of the six highest (max RER, B), and the average of the six lowest (min RER) RER values were calculated for each mouse and condition using data collected for 24 hours (12 hours light and 12 hours dark phase). C: Difference (ΔRER) between the averages of the six highest and the six lowest RER values. n = 4 + 6. *P < 0.05 for WT versus adipo tg mice.
Figure 11
Figure 11
Fat mass expansion during weight gain is mainly due to hypertrophy of the existing adipocytes (A). We hypothesize that adiponectin increases clonal expansion of preadipocytes as well as adipocyte differentiation, which will result in more but smaller adipocytes at a given degree of energy surplus (B).

Similar articles

Cited by

References

    1. Kusminski CM, Shetty S, Orci L, Unger RH, Scherer PE. Diabetes and apoptosis: lipotoxicity. Apoptosis. 2009;14:1484–1495. - PubMed
    1. Heilbronn L, Smith SR, Ravussin E. Failure of fat cell proliferation, mitochondrial function and fat oxidation results in ectopic fat storage, insulin resistance and type II diabetes mellitus. Int J Obes Relat Metab Disord. 2004;28(Suppl 4):S12–S21. - PubMed
    1. Summers SA. Ceramides in insulin resistance and lipotoxicity. Prog Lipid Res. 2006;45:42–72. - PubMed
    1. Capeau J. Insulin resistance and steatosis in humans. Diabetes Metab. 2008;34:649–657. - PubMed
    1. Westerbacka J, Lammi K, Hakkinen AM, Rissanen A, Salminen I, Aro A, Yki-Jarvinen H. Dietary fat content modifies liver fat in overweight nondiabetic subjects. J Clin Endocrinol Metab. 2005;90:2804–2809. - PubMed

Publication types

MeSH terms