

Glioblastoma multiforme regional genetic and cellular expression patterns: influence on anatomic and physiologic MR imaging
- PMID: 20093527
- PMCID: PMC2809924
- DOI: 10.1148/radiol.09090663
Glioblastoma multiforme regional genetic and cellular expression patterns: influence on anatomic and physiologic MR imaging
Abstract
Purpose: To determine whether magnetic resonance (MR) imaging is influenced by genetic and cellular features of glioblastoma multiforme (GBM) aggressiveness.
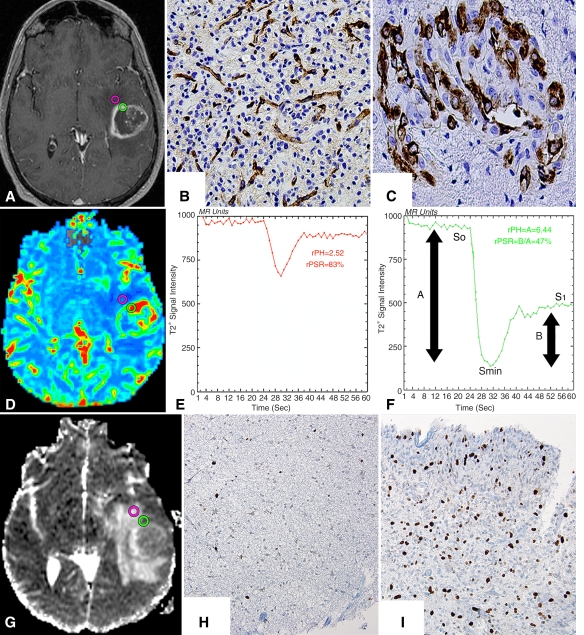
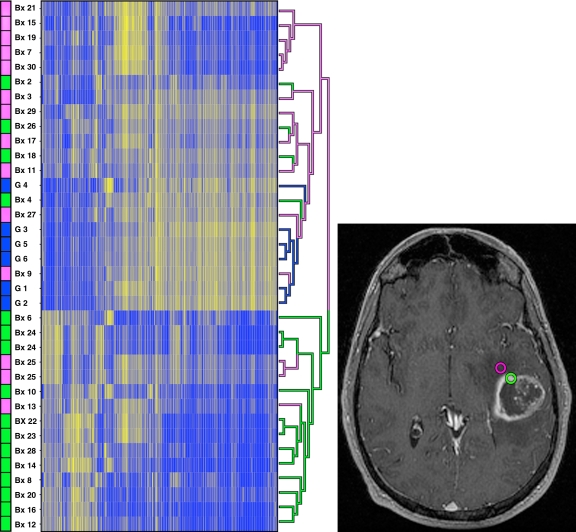
Materials and methods: In this HIPAA-compliant institutional review board-approved study, multiple enhancing and peritumoral nonenhancing stereotactic neurosurgical biopsy samples from treatment-naïve GBMs were collected prospectively, with guidance from cerebral blood volume (CBV) MR imaging measurements. By using monoclonal antibodies, tissue specimens were examined for microvascular expression, hypoxia, tumor and overall cellular density, and histopathologic features of GBM aggressiveness. Genetic expression patterns were investigated with RNA microarrays. Imaging and histopathologic variables were compared with the Welch t test and Pearson correlations. Microarray analysis was performed by using false discovery rate (FDR) statistics.
Results: Tumor biopsy of 13 adult patients yielded 16 enhancing and 14 peritumoral nonenhancing specimens. Enhancing regions had elevated relative CBV and reduced relative apparent diffusion coefficient (ADC) measurements compared with peritumoral nonenhancing biopsy regions (P < .01). A positive correlation was found between relative CBV and all histopathologic features of aggressiveness (P < .04). An inverse correlation was found between relative ADC and all histopathologic features of aggressiveness (P < .05). RNA expression patterns between tumor regions were found to be significantly different (FDR < 0.05), with hierarchical clustering by biopsy region only.
Conclusion: These findings suggest MR imaging is significantly influenced by GBM genetic and cellular biologic features of aggressiveness and imply physiologic MR imaging may be useful in pinpointing regions of highest malignancy within heterogeneous tissues, thus facilitating histologic grading of primary glial brain tumors.
Figures
References
-
- Fulling KH, Garcia DM. Anaplastic astrocytoma of the adult cerebrum: prognostic value of histologic features. Cancer 1985;55:928–931 - PubMed
-
- Kleihues P, Soylemezoglu F, Schäuble B, Scheithauer BW, Burger PC. Histopathology, classification, and grading of gliomas. Glia 1995;15:211–221 - PubMed
-
- Gilles FH, Brown WD, Leviton A. Limitations of the World Health Organization classification of childhood supratentorial astrocytic tumors. Cancer 2000;88:1477–1483 - PubMed
-
- Prayson RA, Agamanolis DP, Cohen ML. Interobserver reproducibility among neuropathologists and surgical pathologists in fibrillary astrocytoma grading. J Neurol Sci 2000;175:33–39 - PubMed
-
- Coons SW, Johnson PC, Scheithauer BW, et al. Improving diagnostic accuracy and interobserver concordance in the classification and grading of primary gliomas. Cancer 1997;79:1381–1393 - PubMed
Publication types
MeSH terms
Substances
Grants and funding
LinkOut - more resources
Full Text Sources
Other Literature Sources
Medical
