. 2010 Mar 19;106(5):981-91.
doi: 10.1161/CIRCRESAHA.109.204891. Epub 2010 Jan 21.

Transmural dispersion of repolarization in failing and nonfailing human ventricle

Affiliations

Transmural dispersion of repolarization in failing and nonfailing human ventricle

Alexey V Glukhov et al. Circ Res. .

Abstract

Rationale: Transmural dispersion of repolarization has been shown to play a role in the genesis of ventricular tachycardia and fibrillation in different animal models of heart failure (HF). Heterogeneous changes of repolarization within the midmyocardial population of ventricular cells have been considered an important contributor to the HF phenotype. However, there is limited electrophysiological data from the human heart.

Objective: To study electrophysiological remodeling of transmural repolarization in the failing and nonfailing human hearts.

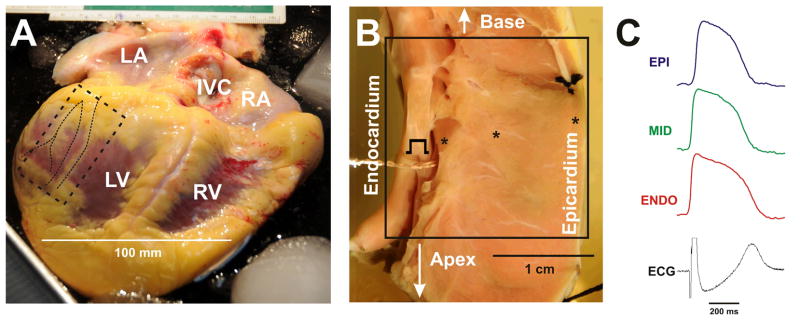
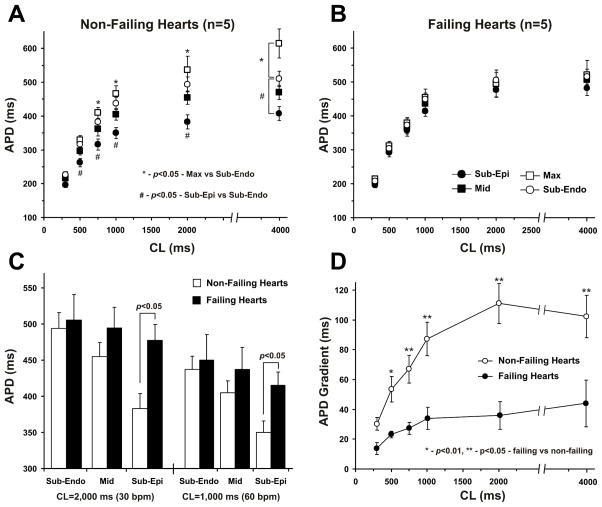
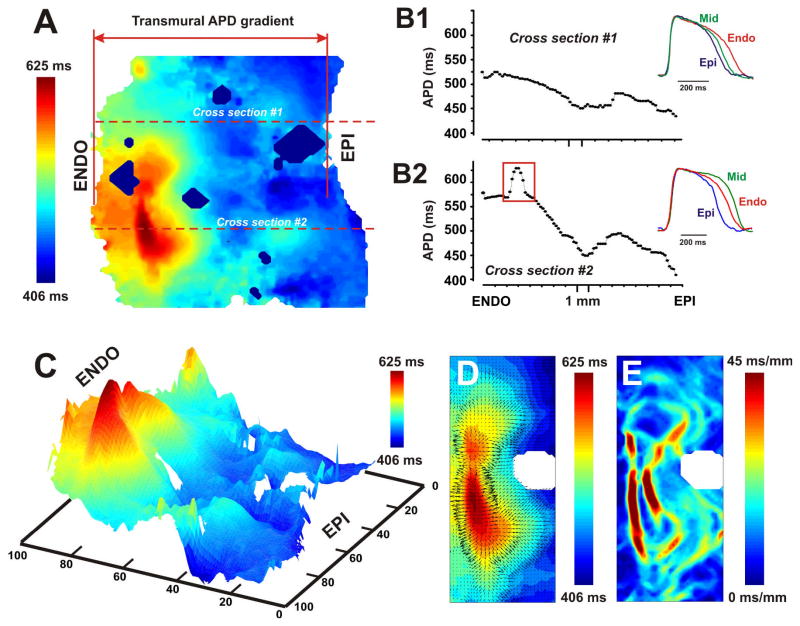
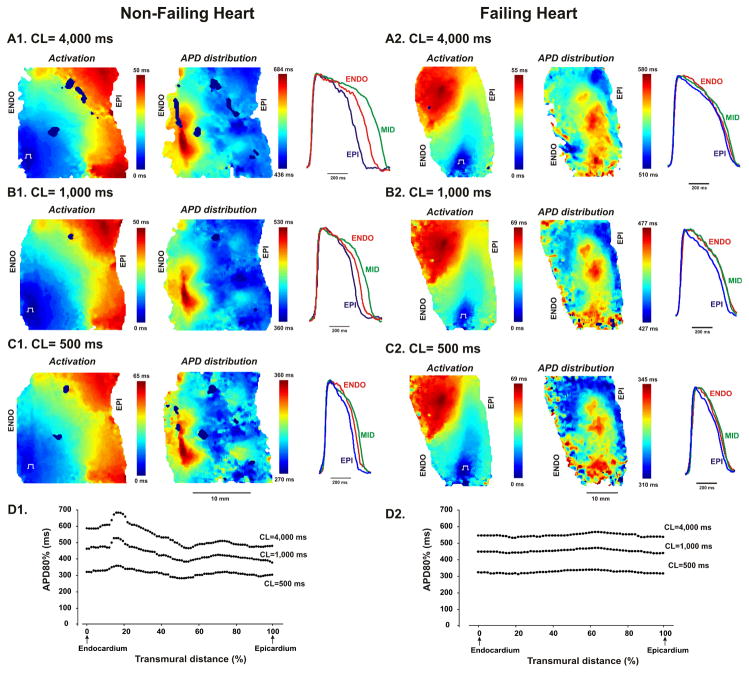
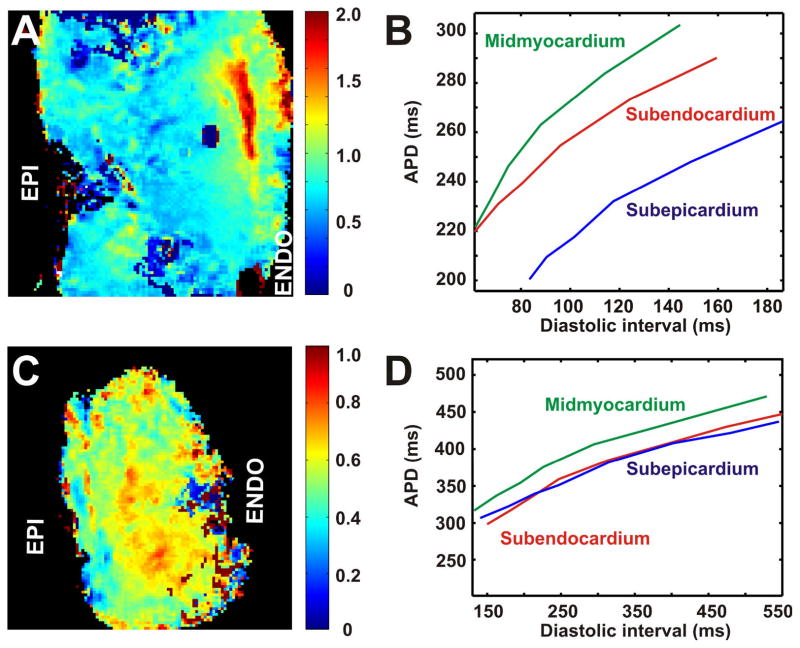
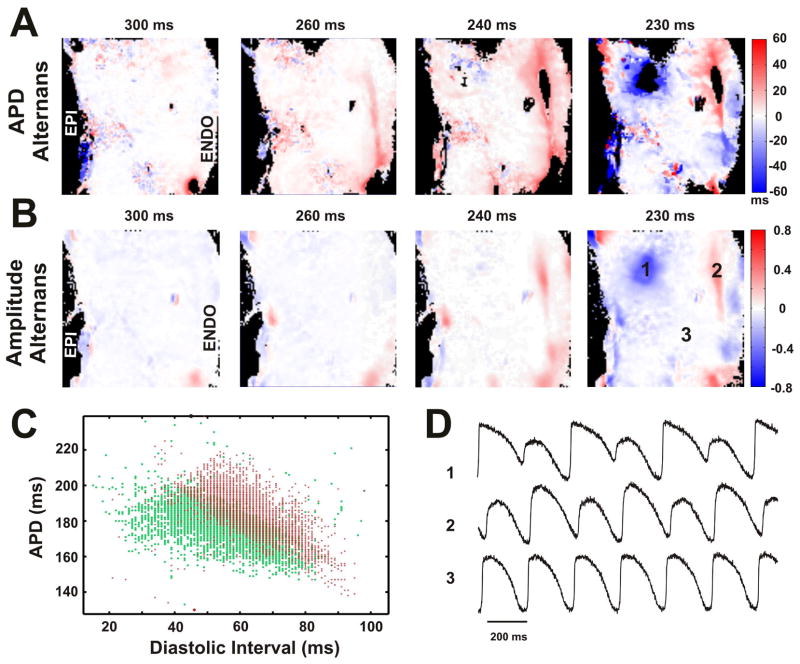
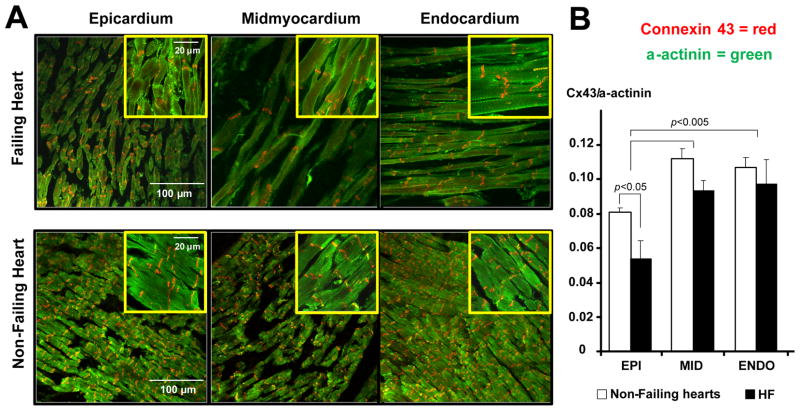
Methods and results: We optically mapped the action potential duration (APD) in the coronary-perfused scar-free posterior-lateral left ventricular free wall wedge preparations from failing (n=5) and nonfailing (n=5) human hearts. During slow pacing (S1S1=2000 ms), in the nonfailing hearts we observed significant transmural APD gradient: subepicardial, midmyocardial, and subendocardial APD80 were 383+/-21, 455+/-20, and 494+/-22 ms, respectively. In 60% of nonfailing hearts (3 of 5), we found midmyocardial islands of cells that presented a distinctly long APD (537+/-40 ms) and a steep local APD gradient (27+/-7 ms/mm) compared with the neighboring myocardium. HF resulted in prolongation of APD80: 477+/-22 ms, 495+/-29 ms, and 506+/-35 ms for the subepi-, mid-, and subendocardium, respectively, while reducing transmural APD80 difference from 111+/-13 to 29+/-6 ms (P<0.005) and presence of any prominent local APD gradient. In HF, immunostaining revealed a significant reduction of connexin43 expression on the subepicardium.

Conclusions: We present for the first time direct experimental evidence of a transmural APD gradient in the human heart. HF results in the heterogeneous prolongation of APD, which significantly reduces the transmural and local APD gradients.


Figures

Figure 1
Figure 1. Human left ventricular wedge preparation
The hearts with cardiomyopathy were available during transplantation (A). For control, non-failing hearts, which were rejected for transplantation, were used. The action potentials were optically mapped in the coronary-perfused and superfused LV wedge preparations (B, non-failing heart #3). Tissue samples from the posterior-lateral LV free wall were used. The sample began several centimeters below the base of the ventricles and extends about 3 cm towards the apex (marked by dotted rectangle on A). The sample was cannulated through the main coronary artery supplying the surrounding tissue. Other small arteries were ligated and an adequate perfusion pressure was maintained (shown on B). The optical field of view is denoted by square on photo B. The examples of optical action potential recordings (at pacing CL=2,000 ms) from the subepicardium, midmyocardium, and subendocardium as well as ECG are presented in C.
Figure 2
Figure 2. Optical mapping of LV wedge preparation
Transmural activation and APD distribution contour maps from non-failing (A, heart #3) and failing (B, heart #4) human hearts are shown at pacing CL=2,000 ms. Optical fields of view are denoted by rectangles on corresponding photos. Endocardial pacing sites are marked. Color scales represent the activation time and APD in corresponding maps. Selected subepicardial (EPI), midmyocardial (MID), and subendocardial (ENDO) action potentials are superimposed and demonstrated for each heart.
Figure 3
Figure 3. Summary data for transmural distribution of action potential duration (APD) in non-failing (n=5) and failing (n=5) human hearts
A. Transmural APD80 distribution in non-failing human hearts at different pacing CL. APD80 were calculated for different transmural areas: sub-epicardium, midmyocardium, sub-endocardium and in the region with the longest APDs (Max). * - p<0.05 for Max cells versus subendocardium; # - p<0.05 for subepicardium versus subendocardium. B. Transmural APD distribution in failing human hearts at different pacing CL. C. APD80 for subendocardial (Sub-Endo), midmyocardial (Mid), and subepicardial (Sub-Epi) layers are presented for non-failing and failing human hearts at 2,000 ms and 1,000 ms pacing CL. * - p<0.05 for non-failing versus failing groups. D. Transmural APD gradients calculated as a difference between the subepicardial and subendocardial APD80 throughout the mapped area are presented for non-failing and failing hearts at different pacing CL. * - p<0.01, ** - p<0.05 for non-failing versus failing groups.
Figure 4
Figure 4. Local action potential duration (APD) gradient as a criterion for definition of islands of cells with prolonged repolarization
The example of the transmural APD distribution contour map is shown (A). Data from the non-failing heart #5 at pacing CL=2,000 ms was used. Two types of APD distribution through the LV wall are plotted for two cross sections (red horizontal dotted lines) passed beyond (B1) and over (B2) the island of prolonged repolarization (trough the cross sections #1 and #2, respectively) marked by the black dotted curve. Selected from the cross section, subepicardial (EPI), midmyocardial (MID), and subendocardial (ENDO) action potentials are superimposed and presented for each APD distribution in B1 and B2. The spatial resolution for this wedge was about 190 μm per pixel. Red rectangle on the panel B2 selects the area of cells with prolonged repolarization in the deep subendocardium. Panel C represents a pseudo-3D map of APD distribution shown in A. Max-APD island is shown in red and characterized be the sharp local APD gradient around it. Panel D demonstrates the magnitude and direction of local APD gradient vectors. The representative example of distribution of the local APD gradient calculated throughout the mapped area is shown in panel E.
Figure 5
Figure 5. Examples of activation and action potential (APD) distribution patterns for non-failing and failing human wedge preparations obtained at different pacing CL during restitution measurements
Data are presented for the non-failing heart #5 and failing heart #2. Three pacing CLs (4,000ms, 1,000ms, and 500ms) from the applied restitution protocol are shown. Superimposed action potentials from the epicardial (EPI), midmyocardial (MID), and endocardial (ENDO) layers are presented for each pacing CL. On the bottom panels, transmural APD distributions at different pacing CL are presented for non-failing (D1) and failing (D2) hearts.
Figure 6
Figure 6. Spatial distribution of action potential duration (APD) restitution through the LV free wall
Data are presented for the non-failing heart #5 (A) and failing heart #2 (B). Spatial distributions of slopes for APD restitution curve for each pixel through the mapped area are presented on the right panels. On the left panels, three restitution curves plotted for pixels from subepicardium, midmyocardium and subendocardium are shown.
Figure 7
Figure 7. Dynamics and localization of action potential duration (A) and action potential amplitude (B) alternans
Data are presented for the non-failing heart #5. Four panels in (A) and (B) represent transmural distribution of alternans during progressive decrease of pacing CL. Colors indicate the amplitude of alternans which can be positive (red) or negative (blue) relative to no alternans (white). C: Plot of APDs against diastolic intervals of consecutive two beats (represented by red and green respectively) for each pixel during pacing with CL of 240ms. The separation of areas with single colors (red or green) indicates the presence of alternans. D: The representative examples of optical recordings from three areas labeled on maps.
Figure 8
Figure 8. Transmural expression of connexin 43
A: Sample confocal images from non-failing and failing hearts taken from the subepicardium, midmyocardium, and subendocardium using a 20x magnification. For each image, the zoomed areas with 100x magnification are presented in corresponding insets. The expression of Cx43 is presented in red, α-actinin – in green. B: Average Cx43 densities at each tissue location. We analyzed 5 randomly selected fields of view in each area of myocardium obtained at 20x magnification. For each image, the ratio of Cx43 to α-actinin was calculated. Average data represent non-failing (n=4) and failing (HF, n=3) human hearts.

Comment in

  • M cells in the human heart.
    Antzelevitch C. Antzelevitch C. Circ Res. 2010 Mar 19;106(5):815-7. doi: 10.1161/CIRCRESAHA.109.216226. Circ Res. 2010. PMID: 20299671 Free PMC article. No abstract available.
  • Does APD gradient indicate dispersion of repolarization ?
    Selvaraj RJ, Nair K. Selvaraj RJ, et al. Circ Res. 2010 Aug 6;107(3):e9; author reply e10. doi: 10.1161/CIRCRESAHA.110.224048. Circ Res. 2010. PMID: 20689067 No abstract available.

Similar articles

Cited by

References

    1. Jin H, Lyon AR, Akar FG. Arrhythmia mechanisms in the failing heart. Pacing Clin Electrophysiol. 2008;31:1048–1056. - PubMed
    1. Tomaselli GF, Zipes DP. What causes sudden death in heart failure? Circ Res. 2004;95:754–763. - PubMed
    1. Nass RD, Aiba T, Tomaselli GF, Akar FG. Mechanisms of disease: ion channel remodeling in the failing ventricle. Nat Clin Pract Cardiovasc Med. 2008;5:196–207. - PubMed
    1. Akar FG, Rosenbaum DS. Transmural electrophysiological heterogeneities underlying arrhythmogenesis in heart failure. Circ Res. 2003;93:638–645. - PubMed
    1. Tomaselli GF, Marban E. Electrophysiological remodeling in hypertrophy and heart failure. Cardiovasc Res. 1999;42:270–283. - PubMed

Publication types

MeSH terms