

In vivo measurement of proximal pulmonary artery elastic modulus in the neonatal calf model of pulmonary hypertension: development and ex vivo validation
- PMID: 20093662
- PMCID: PMC2853208
- DOI: 10.1152/japplphysiol.01173.2009
In vivo measurement of proximal pulmonary artery elastic modulus in the neonatal calf model of pulmonary hypertension: development and ex vivo validation
Abstract
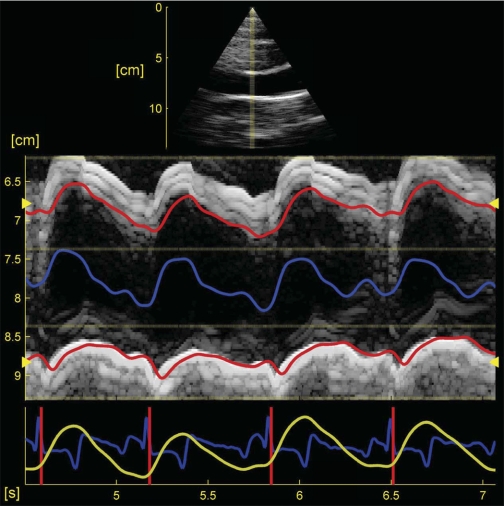
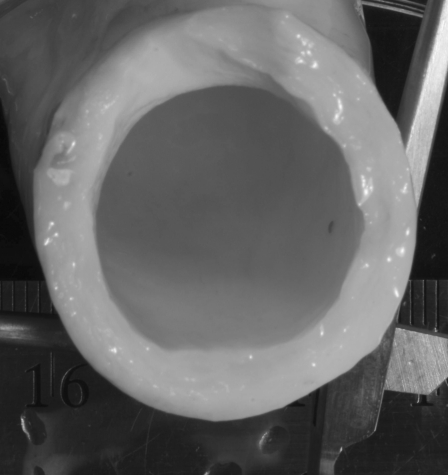
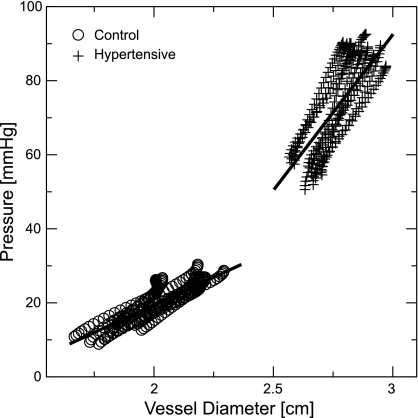
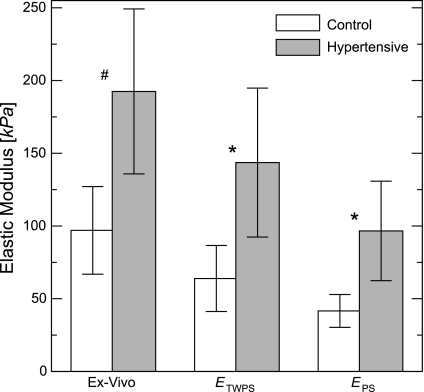
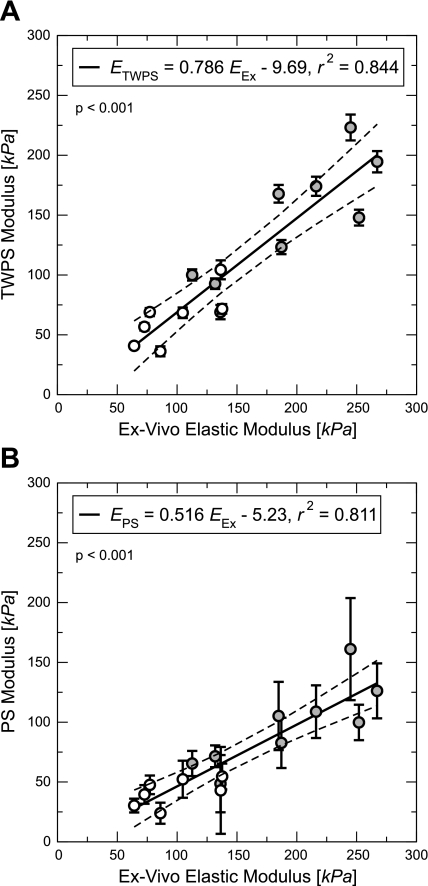
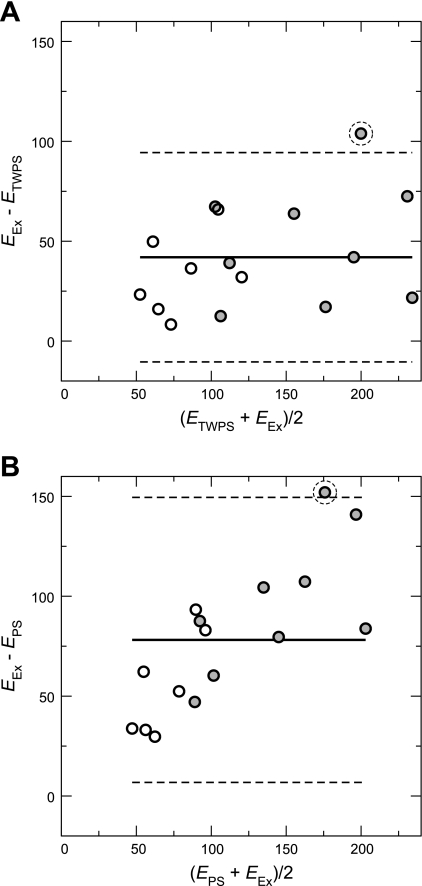
Developing clinical work suggests that vascular stiffening plays a role in the progression of pulmonary hypertension (PH), while recent studies in animal models of hypoxic PH have found significant proximal vascular stiffening in the diseased population. Here, we develop and validate a minimally invasive, clinically realizable method to estimate the local elastic modulus of the proximal pulmonary arteries from pressure-diameter (PD) data. PD measurements were made in the main pulmonary arteries of 16 calves; lumen diameter was assessed using color M-mode tissue Doppler imaging ultrasound, while pressure was measured via catheter. Two methods corresponding to thin-walled pressure vessel theory ("thin") and Lame's equation for a thick-walled cylinder ("thick") were used to approximate the artery elastic modulus from PD measurements. The harvested arteries were tested independently to determine their "true" ex vivo elastic modulus and stiffness. Both approximations displayed excellent correlation with ex vivo elastic modulus of the calf main pulmonary artery (thin r(2) = 0.811; thick r(2) = 0.844; both P < 0.01). Bland-Altman analysis indicated that the thick-walled approximation has better overall agreement with ex vivo modulus. The approximations displayed quantitatively distinct regression slopes that were statistically different (P = 0.02). The elastic modulus of the main pulmonary artery can be reasonably estimated from combined color M-mode tissue Doppler imaging ultrasound and catheter pressure measurements in calves. Such measurements may be a valuable tool in the diagnosis and treatment of human PH.
Figures
References
-
- Armentano R, Simon A, Levenson J, Chau NP, Megnien JL, Pichel R. Effects of hypertension on viscoelasticity of carotid and femoral arteries in humans. Hypertension 26: 48–54, 1995 - PubMed
-
- Balzer DT, Kort HW, Day RW, Corneli HM, Kovalchin JP, Cannon BC, Kaine SF, Ivy DD, Webber SA, Rothman A, Ross RD, Aggarwal S, Takahashi M, Waldman JD. Inhaled nitric oxide as a preoperative test (INOP Test I). The INOP Test Study Group. Circulation 106, Suppl S: I76–I81, 2002 - PubMed
-
- Barst RJ, McGoon M, Torbicki A, Sitbon O, Krowka MJ, Olschewski H, Gaine S. Diagnosis and differential assessment of pulmonary arterial hypertension. J Am Coll Cardiol 43: 40S–47S, 2004 - PubMed
-
- Berger RMF, Cromme-Dijkhuis AH, Hop WCJ, Kruit MN, Hess J. Pulmonary arterial wall distensibility assessed by intravascular ultrasound in children with congenital heart disease. Chest 122: 549–557, 2002 - PubMed
-
- Bland JM, Altman DG. Statistical methods for assessing agreement between two methods of clinical measurement. Lancet 1: 307–310, 1986 - PubMed
Publication types
MeSH terms
Grants and funding
LinkOut - more resources
Full Text Sources
Medical