Differences in end-point force trajectories elicited by electrical stimulation of individual human calf muscles
- PMID: 20095454
- PMCID: PMC2811857
- DOI: 10.1123/jab.25.4.330
Differences in end-point force trajectories elicited by electrical stimulation of individual human calf muscles
Abstract
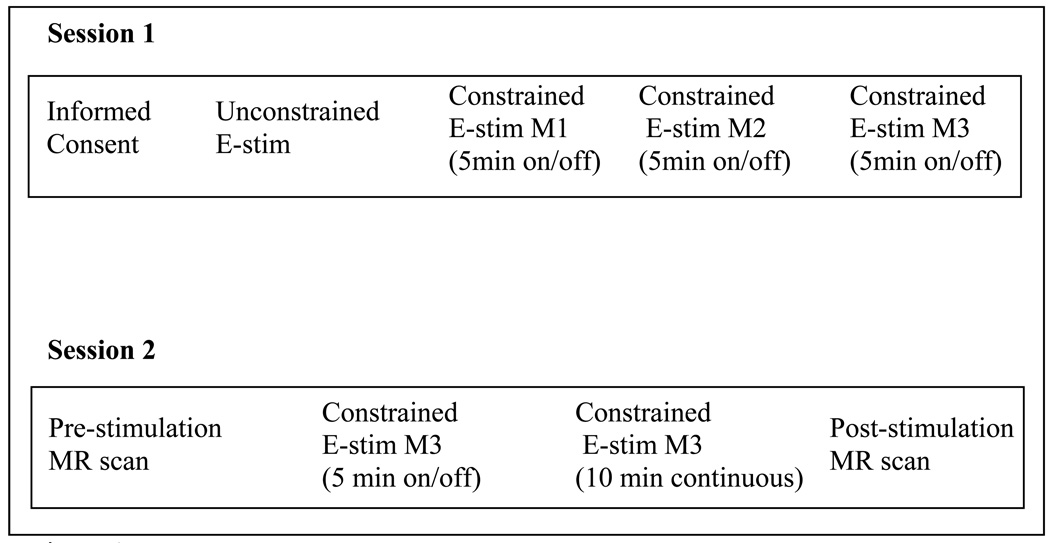
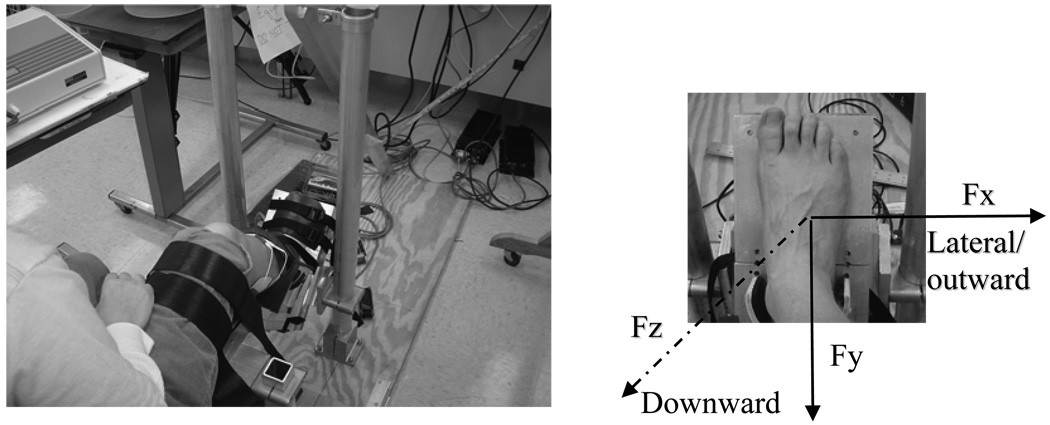
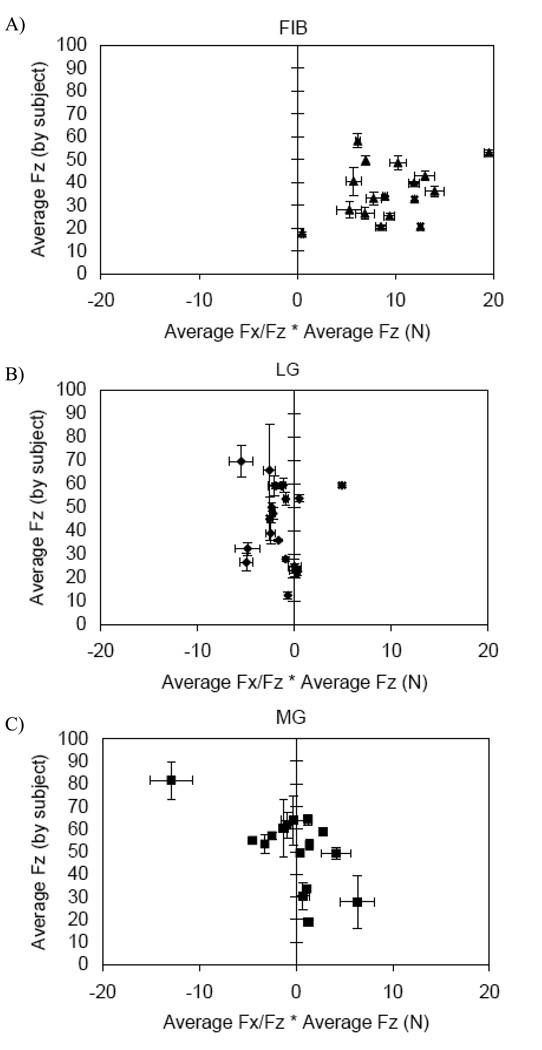
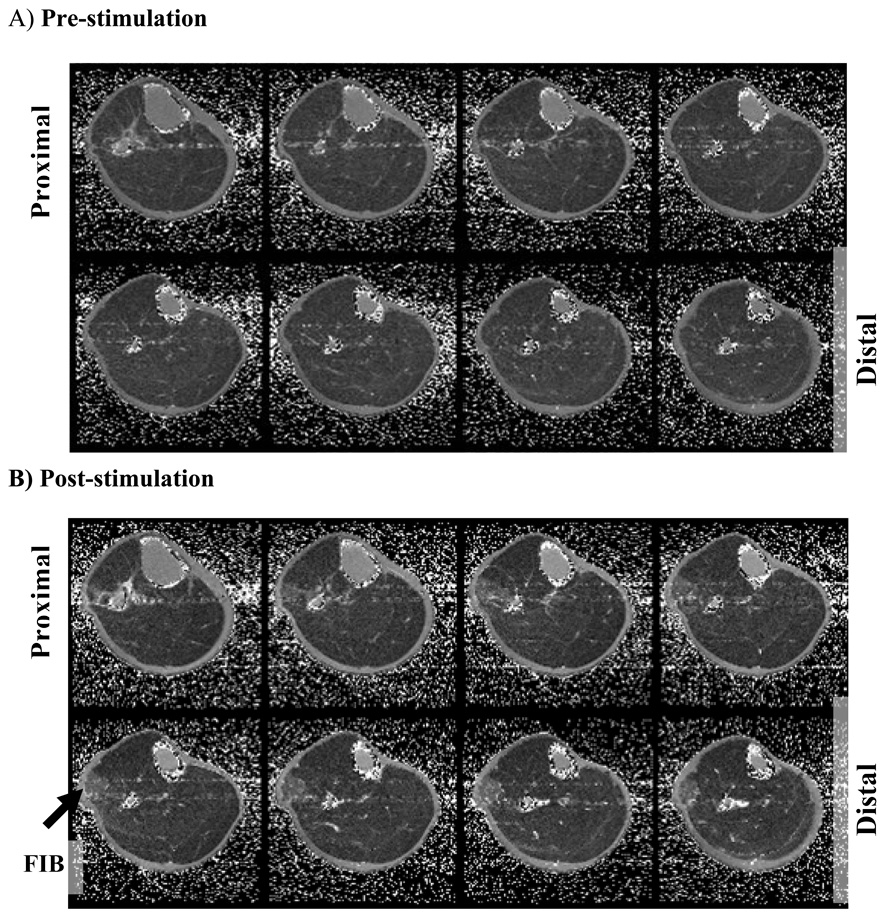
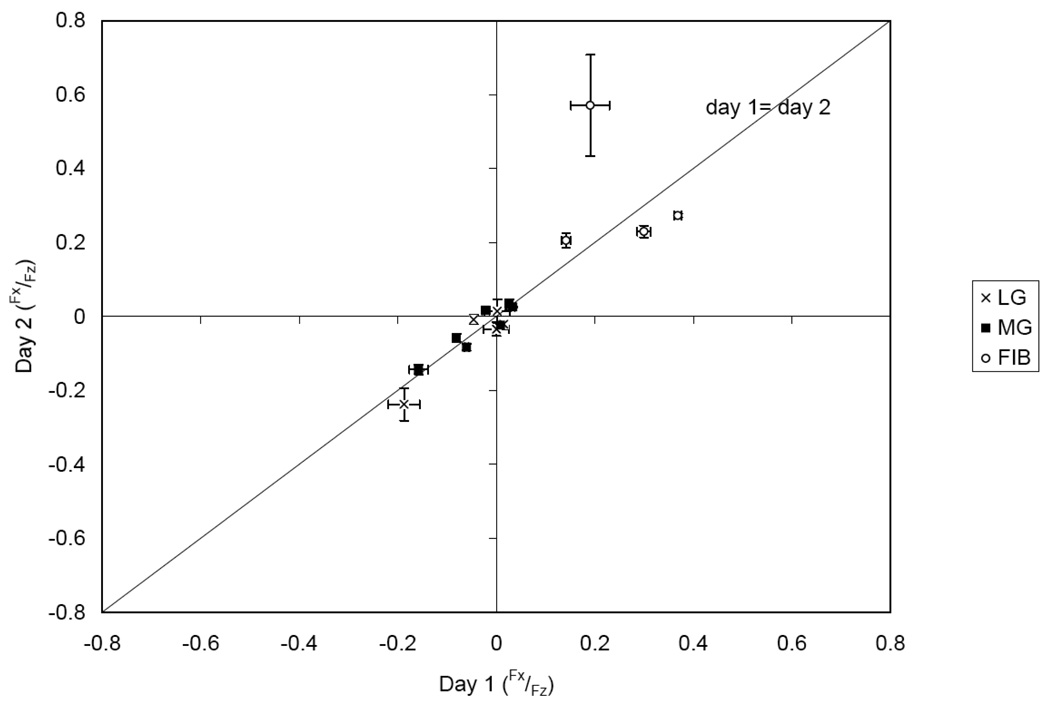
The purpose of this study was to investigate the end-point force trajectories of the fibularis longus (FIB), lateral gastrocnemius (LG), and medial gastrocnemius (MG) muscles. Most information about individual muscle function has come from studies that use models based on electromyographic (EMG) recordings. In this study (N = 20 subjects) we used electrical stimulation (20 Hz) to elicit activity in individual muscles, recorded the end-point forces at the foot, and verified the selectivity of stimulation by using magnetic resonance imaging. Unexpectedly, no significant differences were found between LG and MG force directions. Stimulation of LG and MG resulted in downward and medial or lateral forces depending on the subject. We found FIB end-point forces to be significantly different from those of LG and MG. In all subjects, stimulation of FIB resulted in downward and lateral forces. Based on our results, we suggest that there are multiple factors determining when and whether LG or MG will produce a medial or lateral force and FIB consistently plays a significant role in eversion/abduction and plantar flexion. We suggest that the intersubject variability we found is not simply an artifact of experimental or technical error but is functionally relevant and should be addressed in future studies and models.
Figures
Similar articles
-
How much does the human medial gastrocnemius muscle contribute to ankle torques outside the sagittal plane?Hum Mov Sci. 2013 Aug;32(4):753-67. doi: 10.1016/j.humov.2013.03.003. Epub 2013 Aug 30. Hum Mov Sci. 2013. PMID: 23992638 Free PMC article.
-
Soleus- and gastrocnemii-evoked V-wave responses increase after neuromuscular electrical stimulation training.J Neurophysiol. 2006 Jun;95(6):3328-35. doi: 10.1152/jn.01002.2005. Epub 2006 Feb 15. J Neurophysiol. 2006. PMID: 16481458 Clinical Trial.
-
Quantification of muscle co-contraction using supersonic shear wave imaging.J Biomech. 2016 Feb 8;49(3):493-5. doi: 10.1016/j.jbiomech.2015.12.039. Epub 2015 Dec 31. J Biomech. 2016. PMID: 26776929
-
Contributions to the understanding of gait control.Dan Med J. 2014 Apr;61(4):B4823. Dan Med J. 2014. PMID: 24814597 Review.
-
Force summation between muscles: are muscles independent actuators?Med Sci Sports Exerc. 2009 Jan;41(1):184-90. doi: 10.1249/MSS.0b013e318183c0c3. Med Sci Sports Exerc. 2009. PMID: 19092690 Review.
Cited by
-
How much does the human medial gastrocnemius muscle contribute to ankle torques outside the sagittal plane?Hum Mov Sci. 2013 Aug;32(4):753-67. doi: 10.1016/j.humov.2013.03.003. Epub 2013 Aug 30. Hum Mov Sci. 2013. PMID: 23992638 Free PMC article.
References
-
- Abelew TA, Armstrong B, Burgess AR, Snyder C, Webb R, White R. Differential activation within the triceps surae during lateral hopping movements. Society for Neuroscience Annual Meeting. 2004 Program No. 180.7.
-
- Abelew TA, Burgess AR, Nichols TR. Differential activation of medial and lateral gastrocnemius muscles during voluntary turning. Society for Neuroscience Annual Meeting Program No. 267.7. 2002
-
- Adams GR, Harris RT, Woodard D, Dudley GA. Mapping of electrical muscle stimulation using MRI. J Appl Physiol. 1993;74(2):532–537. - PubMed
-
- Agur AM, Ng-Thow-Hing V, Ball KA, Fiume E, McKee NH. Documentation and three-dimensional modelling of human soleus muscle architecture. Clin Anat. 2003;16(4):285–293. - PubMed
-
- Akima H, Foley JM, Prior BM, Dudley GA, Meyer RA. Vastus lateralis fatigue alters recruitment of musculus quadriceps femoris in humans. J Appl Physiol. 2002;92(2):679–684. - PubMed
Publication types
MeSH terms
Grants and funding
LinkOut - more resources
Full Text Sources