

Adaptive force sonorheometry for assessment of whole blood coagulation
- PMID: 20096680
- PMCID: PMC2911630
- DOI: 10.1016/j.cca.2010.01.018
Adaptive force sonorheometry for assessment of whole blood coagulation
Abstract
Background: Viscoelastic diagnostics that monitor the hemostatic function of whole blood (WB), such as thromboelastography, have been developed with demonstrated clinical utility. By measuring the cumulative effects of all components of hemostasis, viscoelastic diagnostics have circumvented many of the challenges associated with more common tests of blood coagulation.
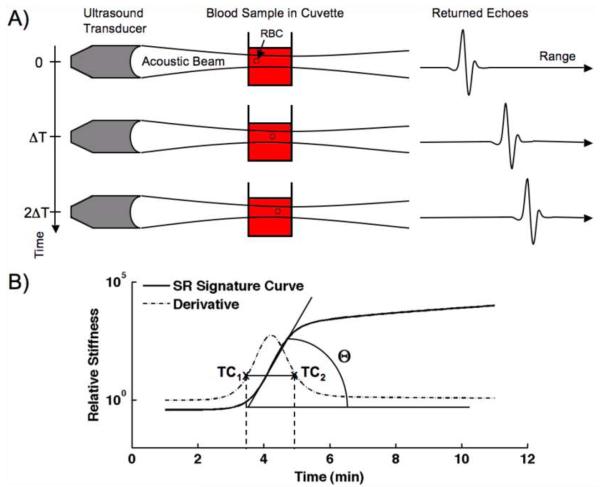
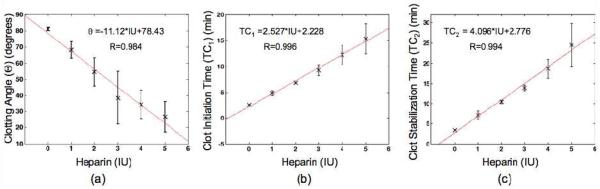
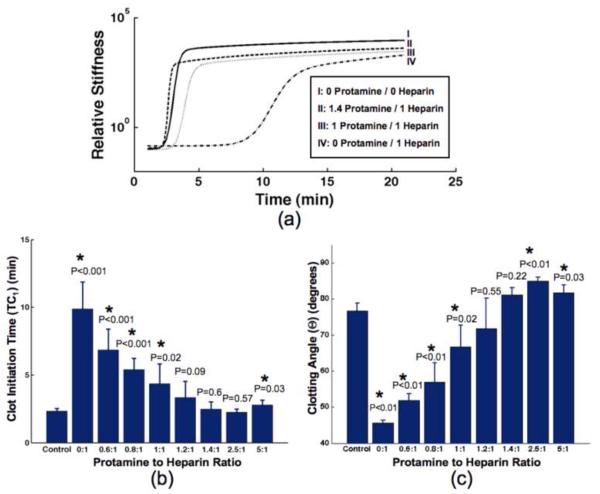
Methods: We describe a new technology, called sonorheometry, that adaptively applies acoustic radiation force to assess coagulation function in WB. The repeatability (precision) of coagulation parameters was assessed using citrated WB samples. A reference range of coagulation parameters, along with corresponding measurements from prothrombin time (PT) and partial thromboplastin time (PTT), were obtained from WB samples of 20 healthy volunteers. In another study, sonorheometry monitored anticoagulation with heparin (0-5 IU/ml) and reversal from varied dosages of protamine (0-10 IU/ml) in heparinized WB (2 IU/ml).
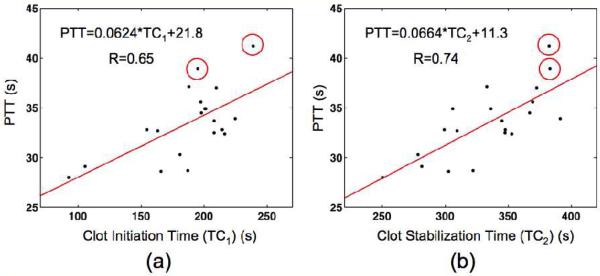
Results: Sonorheometry exhibited low CVs for parameters: clot initiation time (TC1), <7%; clot stabilization time (TC2), <6.5%; and clotting angle (theta), <3.5%. Good correlation was observed between clotting times, TC1 and TC2, and PTT (r=0.65 and 0.74 respectively; n=18). Linearity to heparin dosage was observed with average linearity r>0.98 for all coagulation parameters. We observed maximum reversal of heparin anticoagulation at protamine to heparin ratios of 1.4:1 from TC1 (P=0.6) and 1.2:1 from theta (P=0.55).
Conclusions: Sonorheometry is a non-contact method for precise assessment of WB coagulation.
Copyright 2010 Elsevier B.V. All rights reserved.
Figures
Similar articles
-
A Comparison of a New Ultrasound-Based Whole Blood Viscoelastic Test (SEER Sonorheometry) Versus Thromboelastography in Cardiac Surgery.Anesth Analg. 2016 Dec;123(6):1400-1407. doi: 10.1213/ANE.0000000000001362. Anesth Analg. 2016. PMID: 27159065
-
Comparison of SEER Sonorheometry With Rotational Thromboelastometry and Laboratory Parameters in Cardiac Surgery.Anesth Analg. 2016 Dec;123(6):1390-1399. doi: 10.1213/ANE.0000000000001507. Anesth Analg. 2016. PMID: 27749339
-
SEER Sonorheometry Versus Rotational Thromboelastometry in Large Volume Blood Loss Spine Surgery.Anesth Analg. 2016 Dec;123(6):1380-1389. doi: 10.1213/ANE.0000000000001509. Anesth Analg. 2016. PMID: 27584686
-
Low-Range Heparin and Protamine Detection: A Single-Center Prospective Diagnostic Study.J Cardiothorac Vasc Anesth. 2025 Apr;39(4):933-940. doi: 10.1053/j.jvca.2025.01.009. Epub 2025 Jan 17. J Cardiothorac Vasc Anesth. 2025. PMID: 39890579
-
Emergency medicine misconceptions: Utility of routine coagulation panels in the emergency department setting.Am J Emerg Med. 2020 Jun;38(6):1226-1232. doi: 10.1016/j.ajem.2020.01.057. Epub 2020 Jan 30. Am J Emerg Med. 2020. PMID: 32029342 Review.
Cited by
-
A Review of Vibro-acoustography and its Applications in Medicine.Curr Med Imaging Rev. 2011 Nov 1;7(4):350-359. doi: 10.2174/157340511798038648. Curr Med Imaging Rev. 2011. PMID: 22423235 Free PMC article.
-
Sonic Estimation of Elasticity via Resonance: A New Method of Assessing Hemostasis.Ann Biomed Eng. 2016 May;44(5):1405-24. doi: 10.1007/s10439-015-1460-y. Epub 2015 Sep 23. Ann Biomed Eng. 2016. PMID: 26399992 Free PMC article.
-
Production of acoustic radiation force using ultrasound: methods and applications.Expert Rev Med Devices. 2018 Nov;15(11):819-834. doi: 10.1080/17434440.2018.1538782. Epub 2018 Oct 31. Expert Rev Med Devices. 2018. PMID: 30350736 Free PMC article. Review.
-
Acoustic radiation force elasticity imaging in diagnostic ultrasound.IEEE Trans Ultrason Ferroelectr Freq Control. 2013 Apr;60(4):685-701. doi: 10.1109/TUFFC.2013.2617. IEEE Trans Ultrason Ferroelectr Freq Control. 2013. PMID: 23549529 Free PMC article. Review.
-
Integration of acoustic radiation force and optical imaging for blood plasma clot stiffness measurement.PLoS One. 2015 Jun 4;10(6):e0128799. doi: 10.1371/journal.pone.0128799. eCollection 2015. PLoS One. 2015. PMID: 26042775 Free PMC article.
References
-
- Hoffman M, Monroe DM. A cell-based model of hemostasis. Thromb Haemost. 2001;85:958–65. - PubMed
-
- Hoyert DL, Kung HC, Smith BL. Deaths: preliminary data for 2003. National Vital Statistics Reports. 2005;53:1–48. - PubMed
-
- Hambleton J, Leung LL, Levi M. Coagulation: consultative hemostasis. Hematology Am Soc Hematol Educ Program. 2002;1:335–52. - PubMed
-
- Ferraris VA, Ferraris SP, Saha SP, Hessel EA, Haan CK, Royston BD, Bridges CR, Higgins RSD, Despotis G, Brown JR, Spiess BD, Shore-Lesserson L, Stafford-Smith M, Mazer CD, Bennett-Guerrero E, Hill SE, Body S. Perioperative blood transfusion and blood conservation in cardiac surgery: the society of thoracic surgeons and the society of cardiovascular anesthesiologists clinical practice guideline. Ann Thorac Surg. 2007;83:S27–86. - PubMed
-
- Cohen JA. Activated coagulation time method for control of heparin is reliable during cardiopulmonary bypass. Anesthesiology. 1984;60:121–4. - PubMed
Publication types
MeSH terms
Substances
Grants and funding
LinkOut - more resources
Full Text Sources
Other Literature Sources
