

Pathogenesis of Escherichia coli O157:H7 strain 86-24 following oral infection of BALB/c mice with an intact commensal flora
- PMID: 20096770
- PMCID: PMC2834854
- DOI: 10.1016/j.micpath.2010.01.003
Pathogenesis of Escherichia coli O157:H7 strain 86-24 following oral infection of BALB/c mice with an intact commensal flora
Abstract
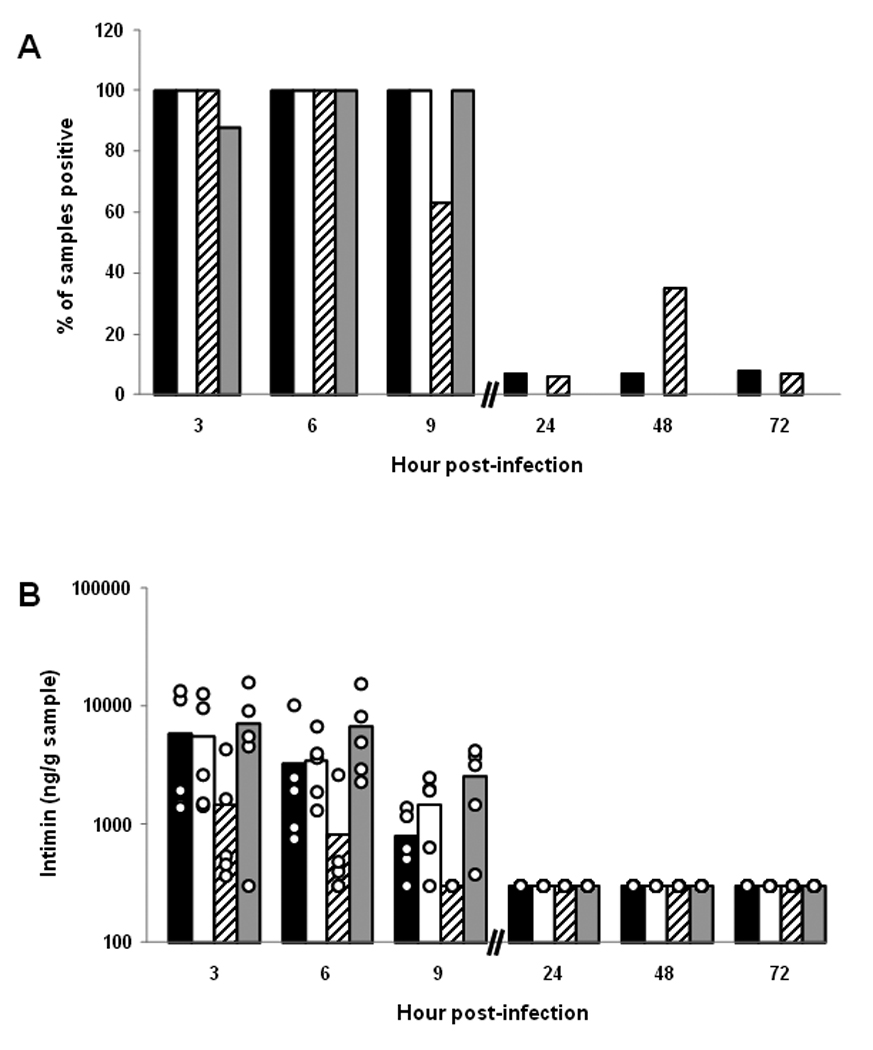
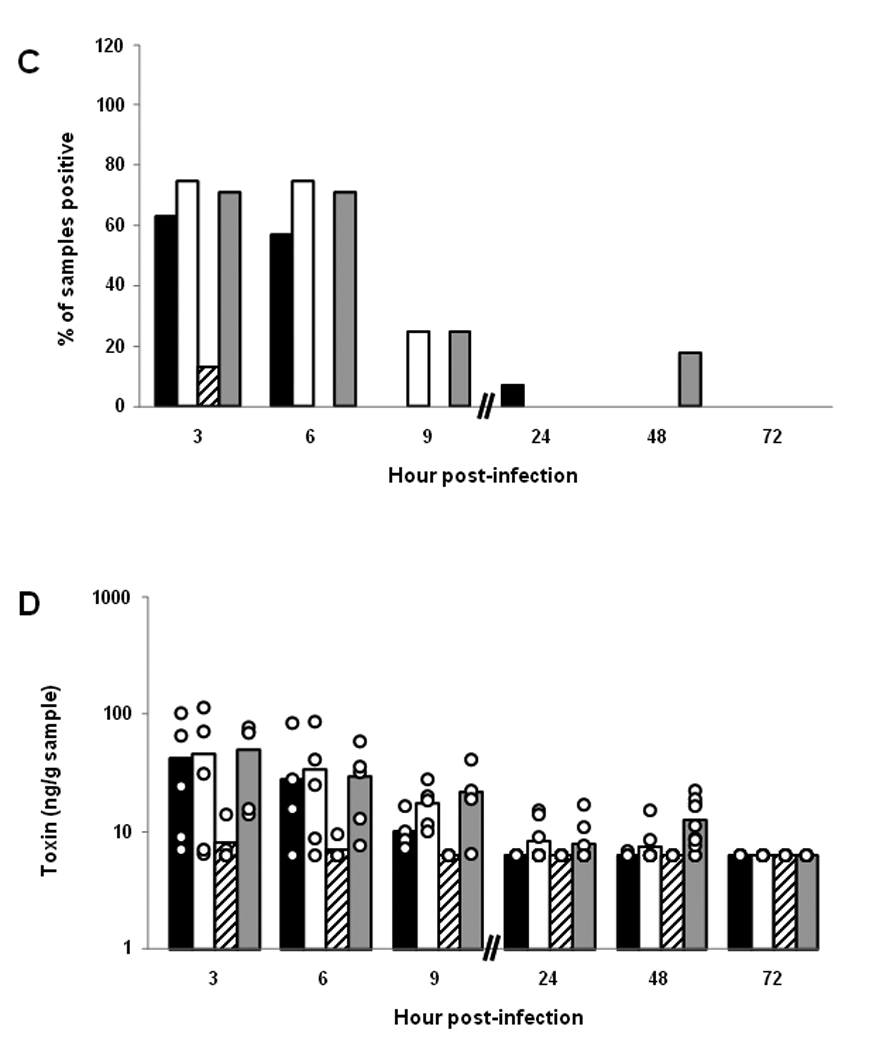
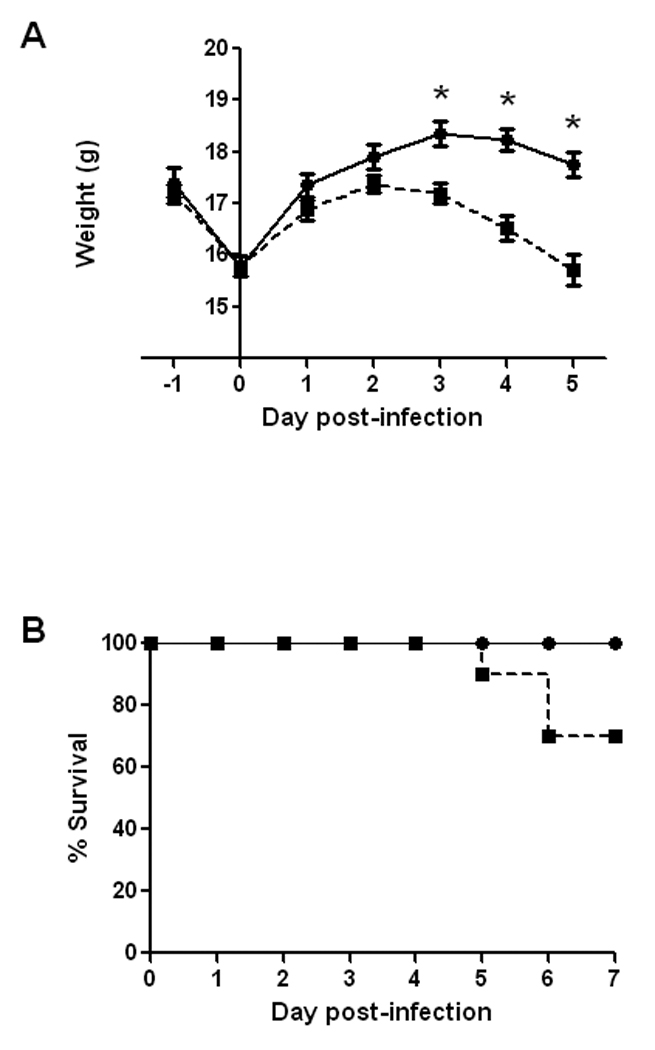
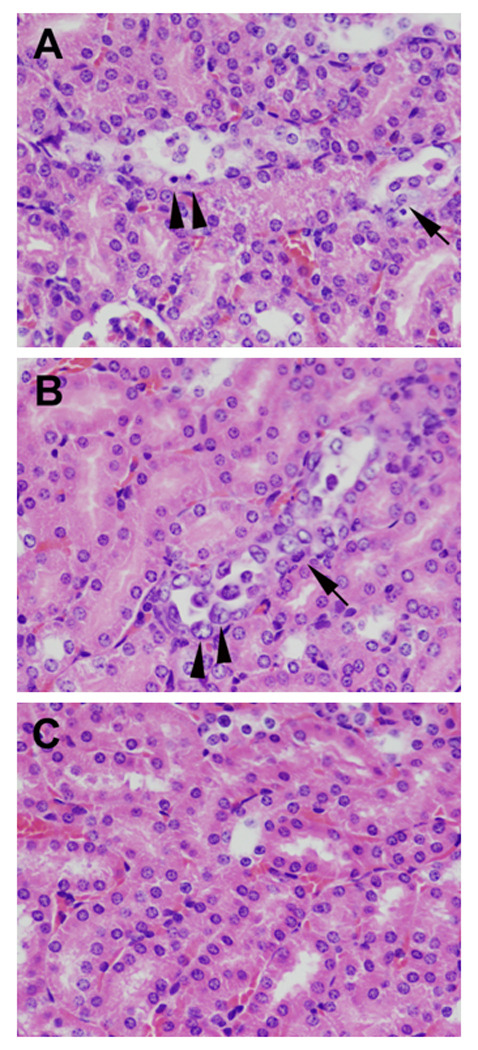
Escherichia coli O157:H7 is a food-borne pathogen that can cause hemorrhagic colitis and, occasionally, hemolytic uremic syndrome, a sequela of infection that can result in renal failure and death. Here we sought to model the pathogenesis of orally-administered E. coli O157:H7 in BALB/c mice with an intact intestinal flora. First, we defined the optimal dose that permitted sustained fecal shedding of E. coli O157:H7 over 7 days ( approximately 10(9) colony forming units). Next, we monitored the load of E. coli O157:H7 in intestinal sections over time and observed that the cecum was consistently the tissue with the highest E. coli O157:H7 recovery. We then followed the expression of two key E. coli O157:H7 virulence factors, the adhesin intimin and Shiga toxin type 2, and detected both proteins early in infection when bacterial burdens were highest. Additionally, we noted that during infection, animals lost weight and approximately 30% died. Moribund animals also exhibited elevated levels of blood urea nitrogen, and, on necropsy, showed evidence of renal tubular damage. We conclude that conventional mice inoculated orally with high doses of E. coli O157:H7 can be used to model both intestinal colonization and subsequent development of certain extraintestinal manifestations of E. coli O157:H7 disease.
Figures
 ), 107 (▲), 108 (
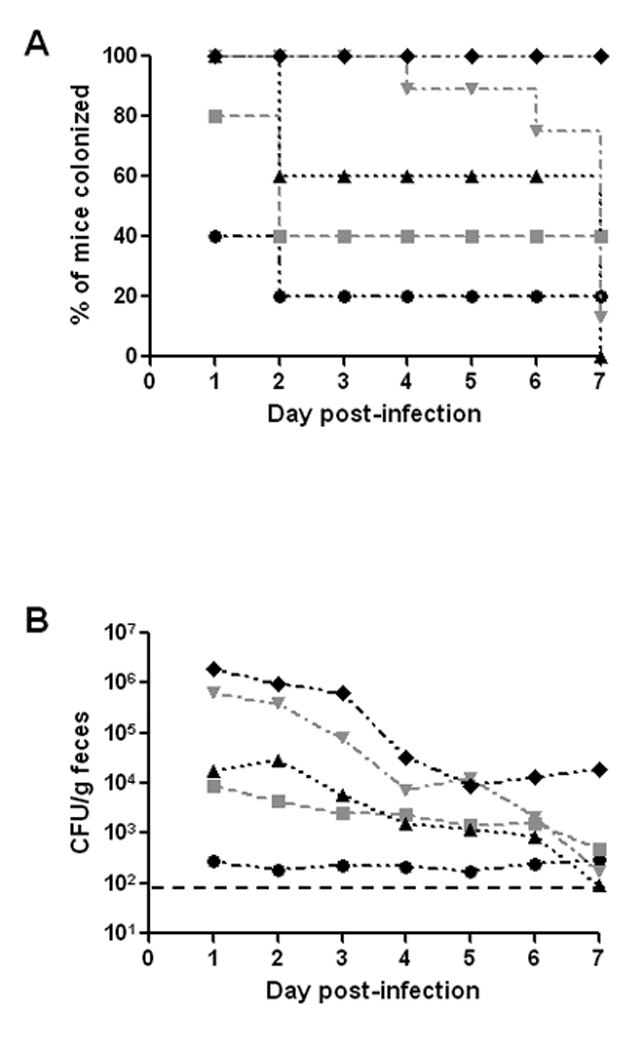
 ), and 109 CFU (♦). Mice were considered colonized if there were recoverable 86-24NalR in the feces. (B) Colonization level of 86-24NalR overtime at various doses administered intragastrically (symbols as above). For panels C and D, animals were infected with 86-24NalR at doses of 108 CFU or 109 CFU either by intragastric administration (dashed lines with for 108 CFU and ♦ for 109 CFU) or pipette feeding (solid lines with
  for 108 CFU and ■ for 109 CFU). (C) Effect of administration route on percent of mice colonized. (D) Impact of administration route on colonization level. For panels A and C, animals that died during the study were excluded from the study after the time of death; these included 2 mice on day 4 from the 109 dose (gavage) and one animal each on days 4 and 5 from the 108 dose (gavage). For panels B and D, each point represents the GM of the number of 86-24NalR shed into the feces from surviving, infected animals, and the limit of detection (indicted by the black dashed line) was 102 CFU/g feces.
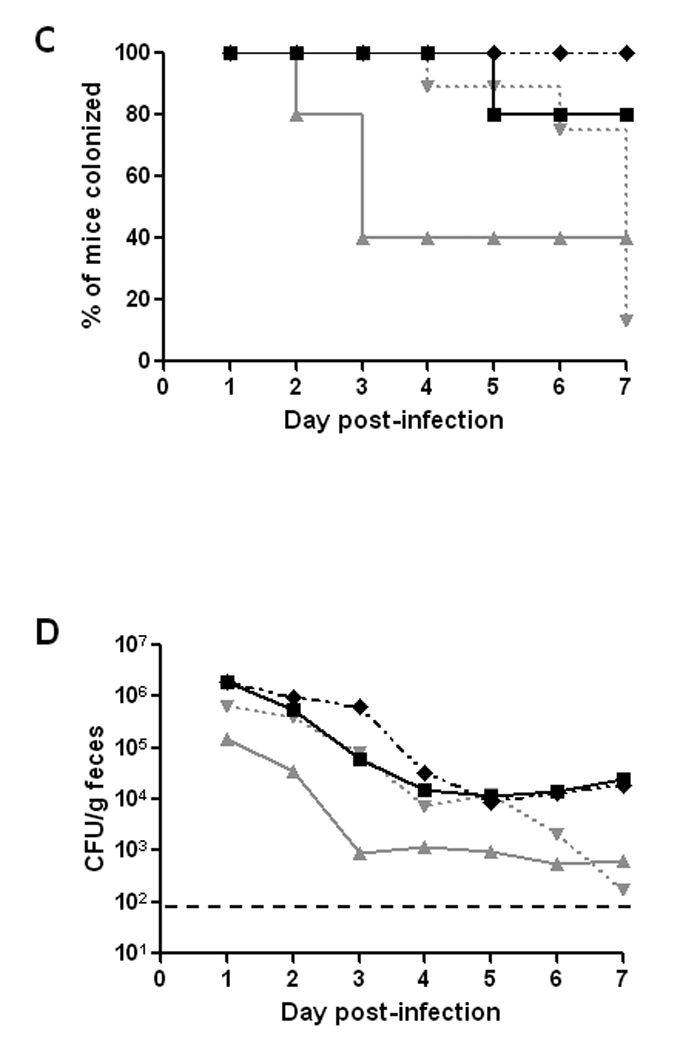 ), 107 (▲), 108 (), and 109 CFU (♦). Mice were considered colonized if there were recoverable 86-24NalR in the feces. (B) Colonization level of 86-24NalR overtime at various doses administered intragastrically (symbols as above). For panels C and D, animals were infected with 86-24NalR at doses of 108 CFU or 109 CFU either by intragastric administration (dashed lines with for 108 CFU and ♦ for 109 CFU) or pipette feeding (solid lines with for 108 CFU and ■ for 109 CFU). (C) Effect of administration route on percent of mice colonized. (D) Impact of administration route on colonization level. For panels A and C, animals that died during the study were excluded from the study after the time of death; these included 2 mice on day 4 from the 109 dose (gavage) and one animal each on days 4 and 5 from the 108 dose (gavage). For panels B and D, each point represents the GM of the number of 86-24NalR shed into the feces from surviving, infected animals, and the limit of detection (indicted by the black dashed line) was 102 CFU/g feces.
 ) as well as the luminal contents of the small intestine (○), cecum (Δ), and large intestine (
 ). Bars indicate the 95% confidence interval.
References
-
- CDC. Update on Multi-State Outbreak of E. coli O157:H7 Infections From Fresh Spinach, October 6, 2006. E coli O157:H7 Outbreak from Fresh Spinach. 2006
-
- Brandt ML, O'Regan S, Rousseau E, Yazbeck S. Surgical complications of the hemolytic-uremic syndrome. J Pediatr Surg. 1990;25:1109–1112. - PubMed
Publication types
MeSH terms
Substances
Grants and funding
LinkOut - more resources
Full Text Sources
Other Literature Sources
Medical
