

Global and local morphometric differences in recently abstinent methamphetamine-dependent individuals
- PMID: 20096794
- PMCID: PMC3478236
- DOI: 10.1016/j.neuroimage.2010.01.056
Global and local morphometric differences in recently abstinent methamphetamine-dependent individuals
Abstract
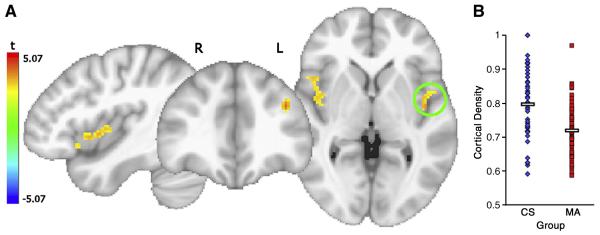
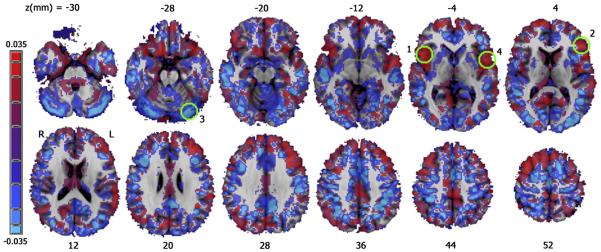
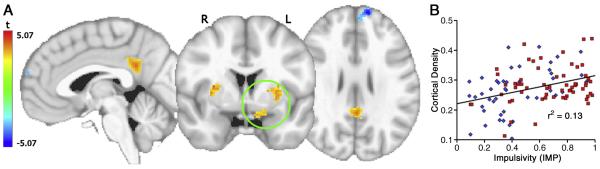
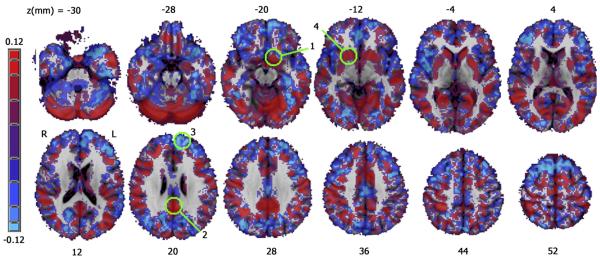
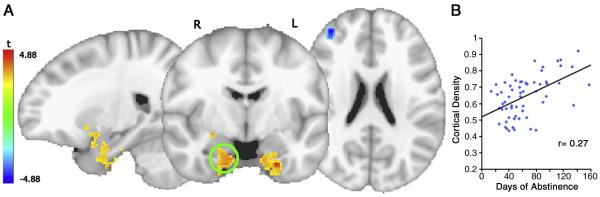
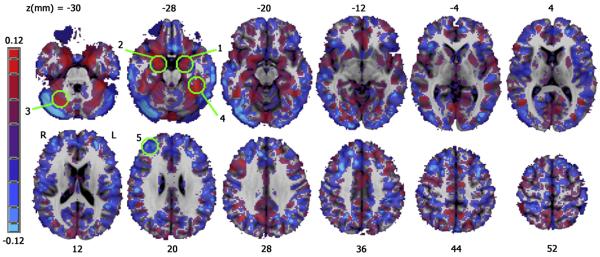
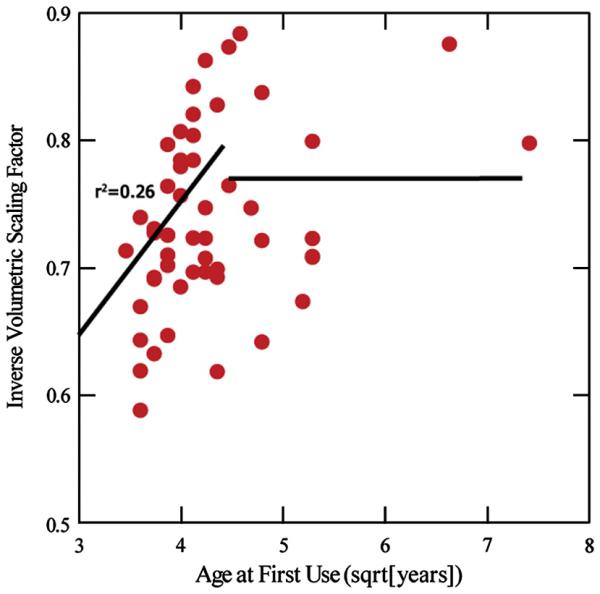
Methamphetamine (MA) is associated with behavioral and cognitive deficits that may be related to macrostructural abnormalities. Quantitative anatomical comparisons between controls and methamphetamine-dependent individuals have produced conflicting results. We examined local and global differences in brain structure in 61 abstinent methamphetamine-dependent individuals and 44 controls with voxel-based morphometry and tissue segmentation. We related regional differences in gray matter density and whole brain segmentation volumes to performance on a behavioral measure of impulsivity and group membership using multiple linear regression. Within the MA group, we related cortical and subcortical gray matter density to length of abstinence. Controls had greater density relative to MA in bilateral insula and left middle frontal gyrus. Impulsivity was higher in the MA group and, within all subjects, impulsivity was positively correlated with gray matter density in posterior cingulate cortex and ventral striatum and negatively correlated in left superior frontal gyrus. Length of abstinence from MA was associated with greater amygdalar density. Earlier age of first use of MA (in subjects who initiated use before age 21) was associated with smaller intracranial volume. The findings are consistent with multiple possible mechanisms including neuroadaptations due to addictive behavior, neuroinflammation as well as dopaminergic and serotonergic neurotoxicity.
2010 Elsevier Inc. All rights reserved.
Figures
Similar articles
-
Gray matter volume showed dynamic alterations in methamphetamine users at 6 and 12months abstinence: A longitudinal voxel-based morphometry study.Prog Neuropsychopharmacol Biol Psychiatry. 2018 Feb 2;81:350-355. doi: 10.1016/j.pnpbp.2017.09.004. Epub 2017 Sep 5. Prog Neuropsychopharmacol Biol Psychiatry. 2018. PMID: 28887180
-
Gray-matter volume in methamphetamine dependence: cigarette smoking and changes with abstinence from methamphetamine.Drug Alcohol Depend. 2012 Oct 1;125(3):230-8. doi: 10.1016/j.drugalcdep.2012.02.017. Epub 2012 Mar 22. Drug Alcohol Depend. 2012. PMID: 22445480 Free PMC article.
-
Structural abnormalities in the brains of human subjects who use methamphetamine.J Neurosci. 2004 Jun 30;24(26):6028-36. doi: 10.1523/JNEUROSCI.0713-04.2004. J Neurosci. 2004. PMID: 15229250 Free PMC article.
-
Gray matter abnormalities as brain structural vulnerability factors for bipolar disorder: A review of neuroimaging studies of individuals at high genetic risk for bipolar disorder.Aust N Z J Psychiatry. 2013 Dec;47(12):1124-35. doi: 10.1177/0004867413496482. Epub 2013 Jul 17. Aust N Z J Psychiatry. 2013. PMID: 23864160 Review.
-
Structural and metabolic brain changes in the striatum associated with methamphetamine abuse.Addiction. 2007 Apr;102 Suppl 1:16-32. doi: 10.1111/j.1360-0443.2006.01782.x. Addiction. 2007. PMID: 17493050 Review.
Cited by
-
Everyday problems with executive dysfunction and impulsivity in adults recovering from methamphetamine addiction.Addict Disord Their Treat. 2016 Mar;15(1):1-5. doi: 10.1097/ADT.0000000000000059. Addict Disord Their Treat. 2016. PMID: 27034621 Free PMC article.
-
Investigating associations of delay discounting with brain structure, working memory, and episodic memory.Cereb Cortex. 2023 Feb 20;33(5):1669-1678. doi: 10.1093/cercor/bhac164. Cereb Cortex. 2023. PMID: 35488441 Free PMC article.
-
Low frequency repetitive transcranial magnetic stimulation of the left dorsolateral prefrontal cortex transiently increases cue-induced craving for methamphetamine: a preliminary study.Drug Alcohol Depend. 2013 Dec 1;133(2):641-6. doi: 10.1016/j.drugalcdep.2013.08.012. Epub 2013 Aug 26. Drug Alcohol Depend. 2013. PMID: 24028801 Free PMC article. Clinical Trial.
-
Anterior insula stimulation suppresses appetitive behavior while inducing forebrain activation in alcohol-preferring rats.Transl Psychiatry. 2020 May 18;10(1):150. doi: 10.1038/s41398-020-0833-7. Transl Psychiatry. 2020. PMID: 32424183 Free PMC article.
-
Functional and structural brain changes associated with methamphetamine abuse.Brain Sci. 2012 Oct 1;2(4):434-82. doi: 10.3390/brainsci2040434. Brain Sci. 2012. PMID: 24961256 Free PMC article.
References
-
- Andersson JLR, Jenkinson M, Smith S. Non-linear optimisation. 2007
-
- Ashburner J, Friston KJ. Voxel-based morphometry--the methods. Neuroimage. 2000;11:805–821. - PubMed
-
- Bechara A. Decision making, impulse control and loss of willpower to resist drugs: a neurocognitive perspective. Nat.Neurosci. 2005;8:1458–1463. - PubMed
Publication types
MeSH terms
Substances
Grants and funding
LinkOut - more resources
Full Text Sources
Medical
