

Validation of a high-throughput methodology to assess the effects of biomaterials on dendritic cell phenotype
- PMID: 20097314
- PMCID: PMC3970709
- DOI: 10.1016/j.actbio.2010.01.023
Validation of a high-throughput methodology to assess the effects of biomaterials on dendritic cell phenotype
Abstract
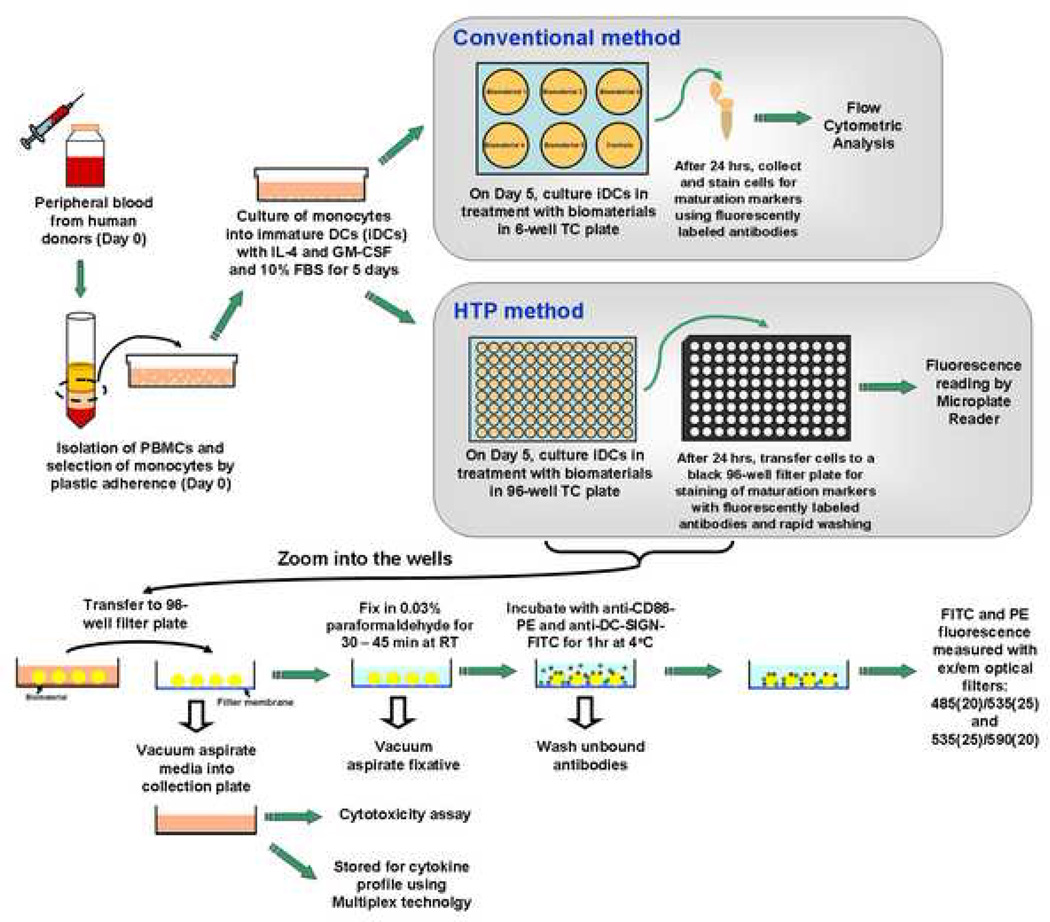
A variety of combination products composed of biomaterials and biologics have been developed for tissue regeneration or vaccine delivery. The host immune response to the immunogenic biological components in such products may be modulated by the biomaterial component. Distinct biomaterials have been shown to differentially affect the maturation of dendritic cells (DCs). DCs are professional antigen-presenting cells (APCs) that bridge innate and adaptive immunity and play a central role in inducing immunity or initiating immune tolerance. However, the biomaterials systems used to study DC response thus far have been insufficient to draw a clear conclusion as to which biomaterial properties are the key to controlling DC phenotype. In this study, we developed a 96-well filter plate-based high-throughput (HTP) methodology to assess DC maturation upon biomaterial treatment. Equivalent biomaterial effects on DC phenotype were measured using the conventional flow cytometric and filter-plate method, which validated the HTP methodology. This methodology will be used to screen a large number of biomaterials simultaneously and to draw correlations between material properties and DC phenotype, thereby providing biomaterial design criteria and immunomodulatory strategies for both tissue engineering and vaccine delivery applications.
Copyright 2010 Acta Materialia Inc. Published by Elsevier Ltd. All rights reserved.
Figures
Similar articles
-
The role of dendritic cells in the immunomodulation to implanted biomaterials.Int J Oral Sci. 2022 Nov 4;14(1):52. doi: 10.1038/s41368-022-00203-2. Int J Oral Sci. 2022. PMID: 36333287 Free PMC article. Review.
-
Role of dendritic cells in the host response to biomaterials and their signaling pathways.Acta Biomater. 2019 Aug;94:132-144. doi: 10.1016/j.actbio.2019.05.038. Epub 2019 May 17. Acta Biomater. 2019. PMID: 31108257 Review.
-
Macrophage and dendritic cell phenotypic diversity in the context of biomaterials.J Biomed Mater Res A. 2011 Jan;96(1):239-60. doi: 10.1002/jbm.a.32971. Epub 2010 Nov 10. J Biomed Mater Res A. 2011. PMID: 21105173 Review.
-
Predicting biomaterial property-dendritic cell phenotype relationships from the multivariate analysis of responses to polymethacrylates.Biomaterials. 2012 Feb;33(6):1699-713. doi: 10.1016/j.biomaterials.2011.10.066. Epub 2011 Dec 1. Biomaterials. 2012. PMID: 22136715 Free PMC article.
-
Biomaterials Facilitating Dendritic Cell-Mediated Cancer Immunotherapy.Adv Sci (Weinh). 2023 Jun;10(18):e2301339. doi: 10.1002/advs.202301339. Epub 2023 Apr 23. Adv Sci (Weinh). 2023. PMID: 37088780 Free PMC article. Review.
Cited by
-
The role of dendritic cells in the immunomodulation to implanted biomaterials.Int J Oral Sci. 2022 Nov 4;14(1):52. doi: 10.1038/s41368-022-00203-2. Int J Oral Sci. 2022. PMID: 36333287 Free PMC article. Review.
-
Presentation Modality of Glycoconjugates Modulates Dendritic Cell Phenotype.Biomater Sci. 2014 Oct 1;2(10):1426-1439. doi: 10.1039/C4BM00138A. Biomater Sci. 2014. PMID: 26146546 Free PMC article.
-
Combinatorial co-encapsulation of hydrophobic molecules in poly(lactide-co-glycolide) microparticles.Biomaterials. 2013 Apr;34(13):3422-30. doi: 10.1016/j.biomaterials.2013.01.032. Epub 2013 Feb 1. Biomaterials. 2013. PMID: 23375950 Free PMC article.
-
Biomaterial Strategies for Immunomodulation.Annu Rev Biomed Eng. 2015;17:317-49. doi: 10.1146/annurev-bioeng-071813-104814. Epub 2015 Sep 29. Annu Rev Biomed Eng. 2015. PMID: 26421896 Free PMC article. Review.
-
Immune tuning scaffold for the local induction of a pro-regenerative environment.Sci Rep. 2017 Dec 5;7(1):17030. doi: 10.1038/s41598-017-16895-0. Sci Rep. 2017. PMID: 29208986 Free PMC article.
References
-
- Banchereau J, Steinman RM. Dendritic cells and the control of immunity. Nature. 1998;392:245–252. - PubMed
-
- Shortman K, Liu YJ. Mouse and human dendritic cell subtypes. Nat Rev Immunol. 2002;2:151–161. - PubMed
-
- Shortman K, Naik SH. Steady-state and inflammatory dendritic-cell development. Nat Rev Immunol. 2007;7:19–30. - PubMed
-
- Ouaaz F, Arron J, Zheng Y, Choi YW, Beg AA. Dendritic cell development and survival require distinct NF-kappa B subunits. Immunity. 2002;16:257–270. - PubMed
-
- Pulendran B, Palucka K, Banchereau J. Sensing pathogens and tuning immune responses. Science. 2001;293:253–256. - PubMed
Publication types
MeSH terms
Substances
Grants and funding
LinkOut - more resources
Full Text Sources
Miscellaneous
