. 2010 Apr;298(4):L509-20.
doi: 10.1152/ajplung.00230.2009. Epub 2010 Jan 22.

Rac1-mediated NADPH oxidase release of O2- regulates epithelial sodium channel activity in the alveolar epithelium

Affiliations

Rac1-mediated NADPH oxidase release of O2- regulates epithelial sodium channel activity in the alveolar epithelium

Yoshizumi Takemura et al. Am J Physiol Lung Cell Mol Physiol. 2010 Apr.

Abstract

We examine whether alveolar cells can control release of O(2)(-) through regulated NADPH oxidase (NOX) 2 (NOX2) activity to maintain lung fluid homeostasis. Using FACS to purify alveolar epithelial cells, we show that type 1 cells robustly express each of the critical NOX components that catalyze the production of O(2)(-) (NOX2 or gp91(phox), p22(phox), p67(phox), p47(phox), and p40(phox) subunits) as well as Rac1 at substantially higher levels than type 2 cells. Immunohistochemical labeling of lung tissue shows that Rac1 expression is cytoplasmic and resides near the apical surface of type 1 cells, whereas NOX2 coimmunoprecipitates with epithelial sodium channel (ENaC). Since Rac1 is a known regulator of NOX2, and hence O(2)(-) release, we tested whether inhibition or activation of Rac1 influenced ENaC activity. Indeed, 1 microM NSC23766 inhibition of Rac1 decreased O(2)(-) output in lung cells and significantly decreased ENaC activity from 0.87 +/- 0.16 to 0.52 +/- 0.16 [mean number of channels (N) and single-channel open probability (P(o)) (NP(o)) +/- SE, n = 6; P < 0.05] in type 2 cells. NSC23766 (10 microM) decreased ENaC NP(o) from 1.16 +/- 0.27 to 0.38 +/- 0.10 (n = 6 in type 1 cells). Conversely, 10 ng/ml EGF (a known stimulator of both Rac1 and O(2)(-) release) increased ENaC NP(o) values in both type 1 and 2 cells. NP(o) values increased from 0.48 +/- 0.21 to 0.91 +/- 0.28 in type 2 cells (P < 0.05; n = 10). In type 1 cells, ENaC activity also significantly increased from 0.40 +/- 0.15 to 0.60 +/- 0.23 following EGF treatment (n = 7). Sequestering O(2)(-) using 2,2,6,6-tetramethylpiperidine-N-oxyl (TEMPO) compound prevented EGF activation of ENaC in both type 1 and 2 cells. In conclusion, we report that Rac1-mediated NOX2 activity is an important component in O(2)(-) regulation of ENaC.


Figures
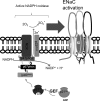
Fig. 1.
Fig. 1.
Schematic of NADPH oxidase (NOX) complex signaling and epithelial sodium channel (ENaC) in apical membrane. NOX2 is a multiprotein enzyme complex with the catalytic subunit (NOX2) stabilized at the cellular membrane via association with p22phox subunit. Complete activation of the catalytic domain requires appropriate assembly of cytoplasmic p47phox, p67phox, and p40phox subunits. These cytoplasmic subunits are under the control of monomeric G protein, Rac1, which cycles between an active GTP-bound state and inactive GDP-bound state [regulated by guanine nucleotide exchange factors (GEFs)], which exchanges GTP for GDP. This figure depicts activated NOX2 complex proximal to ENaCs. P, phosphorylated; 2e, 2 electrons.
Fig. 2.
Fig. 2.
FACS of alveolar type 1 and 2 cells. A: flow cytometry sorts heterogeneous lung cells based on size and fluorescent marker binding. The inset (top left) shows an type 2 cell, which are small and cuboidal cells with basal surface area averaging 180 μm2 (reviewed in Ref. 10). Type 1 cells are significantly larger, with morphometric data indicating that the membrane surface area averages 5,000 μm2 (reviewed in Ref. 10). B: side light scatter (SSC) and forward light scatter (FSC) dot blots of single suspension lung cells. FSC is indicative of cell size, and SSC is indicative of granularity. Of the large cells gated in G1, we selected cells that were additionally bound to Erythrina crista-galli Lectin (ECL), which is a vital dye that binds to type 1 cells with selectivity. The cells gated in G2 were additionally sorted for LysoTracker Red (LTR) fluorescence. C: fluorescence 1 [FL1; enhanced green fluorescent protein (eGFP)] vs. fluorescence 2 (FL2; LTR) dot blot of lung cells. The dot blot shows the distinct scatter profiles of type 1 cells [in region 1 (R1)] and 2 cells [in region 2 (R2)]. Postsort analysis confirmed similar fluorescent and FSC scatter profiles of isolated type 1 and 2 cells (data not shown). FS, forward scatter; SS, side scatter; H, height.
Fig. 3.
Fig. 3.
Western blot analysis of type 1 (T1) and 2 (T2) cell purity. A: 200,000 type 1 and 2 cells, obtained using FACS, were lysed and analyzed using standard polyacrylamide gel electrophoresis. In both A and B, lane 1 = FACS-isolated type 1 cells, and lane 2 = FACS sorted type 2 cells. A shows that only lane 1 is immunoreactive with anti-rat type 1 antibody (RTI40). Conversely, B shows that only lane 2 is immunoreactive with surfactant protein C (SP-C) antibody.
Fig. 4.
Fig. 4.
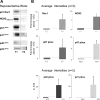
Type 1 cells robustly express Rac1 and NOX2. A: equal number FACS-sorted type 1 (lane 1) and type 2 (lane 2) cells were lysed and analyzed. Blots show robust Rac1 and NOX2 subunit expression in type 1 cells; NOX2 and Rac1 expression levels in equal number type 2 cells were not as pronounced. B: relative luminescence intensities from 3 independent experiments (with protein lysate derived from 3 different animals and FACS); type 2 (AT2) cell values were set to an arbitrary value of 1, and type 1 (AT1) protein was expressed as fold increase above (X) 1.
Fig. 5.
Fig. 5.
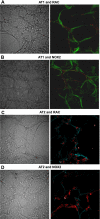
Immunohistochemical detection of Rac1 and NOX2 in paraformaldehyde-fixed lung slices. In each figure, the left and right are of the same cell. The left shows bright field illumination, and right shows fluorescent excitation of antibodies/vital dyes as described below. All images were original ×40 magnification using 200-μm lung tissue slices. A: right: type 1 cells identified using ECL (green). Anti-rabbit Rac1 antibody labeling [detected using rabbit secondary antibody conjugated to Alexa Fluor 568 (red)] shows cytoplasmic Rac1 expression in type 1 cells. B: right: ECL labeling of type 1 cells, lung slice counter-stained with anti-rabbit NOX2 antibody (detected using secondary antibody conjugated to Alexa Fluor 568) shows NOX2 catalytic domain facing lumen of airways. C: right: type 2 cells identified using LTR. Anti-rabbit Rac1 antibody labeling [detected using rabbit secondary antibody conjugated to Alexa Fluor 488 (pseudocolored cyan)] shows Rac1 expression in alveolar epithelial cells. D: LTR labeling of type 2 cells, lung slice counter-stained with anti-rabbit NOX2 antibody detected using secondary antibody conjugated to Alexa Fluor 488 (pseudocolored cyan).
Fig. 6.
Fig. 6.
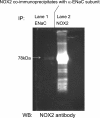
ENaC coimmunoprecipitates with NOX2 catalytic domain. Western blot (WB) analysis of immunoprecipitated (IP) protein, derived from rat primary alveolar epithelial cells, using either goat anti-α-ENaC subunit antibody (lane 1) or rabbit anti-NOX2 antibody (lane 2; positive signal control). Detection of NOX2 in IP studies was done so using standard Western blot protocols and rabbit anti-NOX2 primary antibody. The typical glycosylation smear for NOX2 [which runs between 90 and 65 kDa (20)] was observed in both lane 1 and 2.
Fig. 7.
Fig. 7.
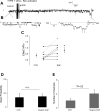
NSC23766, a specific Rac1 inhibitor, decreases ENaC activity in type 1 cells. A: representative patch-clamp recording obtained from a type 1 cell accessed in situ. #Point of 10 μM NSC23766 application to continuous patch following control recording period. B: enlarged portion of continuous trace showing 8-pS highly selective channel (HSC) and 37.5-pS nonselective channel (NSC) present in the same patch of membrane. Inhibition of Rac1 activity decreased both NSC and HSC activity in representative trace. Arrows indicate closed state, and inward currents are seen as downward deflections from closed state. C: results of 6 independent observations (HSCs and NSCs included) shown on dot-plot graphs with y-axis = ENaC number of open channels (NPo). In each observation plotted, Rac1 significantly decreased ENaC NPo values; on average, NPo decreased from 1.16 ± 0.27 to 0.38 ± 0.10; P < 0.05.
Fig. 8.
Fig. 8.
NSC23766 inhibits ENaC in type 2 cells. A: representative recording of a type 2 cell accessed in situ. NSC23766 Rac1 inhibitor (1 μM) applied to cell-attached patch (near #) following a control recording period. B: segment of continuous recording enlarged to show detail of 28-pS NSC that decreased in activity immediately following Rac1 inhibition. Arrow indicates closed state, and downward deflections represent inward Na currents. C: dot-plot graphs showing ENaC NPo before and after drug treatment. NSC23766 decreased channel activity in each independent observation, on average from 0.87 ± 0.16 to 0.52 ± 0.16, n = 6; P < 0.05.
Fig. 9.
Fig. 9.
Inhibiting Rac1 activity significantly decreases O2 production. Left: NSC23766 significantly decreases the production of the O2-specific product 2-hydroxyethidium (2-OH-E+; gray bars) without altering levels of other reactive oxygen species (black bars); n = 3 independent observations in model A6 cells; P < 0.05. Right: fluorescent detection (relative light units; RLU) of 2-OH-E+ in primary alveolar epithelial cells confirm that NSC23766 compound significantly decreases O2 production in pneumocytes; n = 3 independent observations, with sample size of ≥12 wells per experiment. Oxy E, oxyethidium; n.s., not significant; CTR, control.
Fig. 10.
Fig. 10.
EGF acutely increases ENaC activity in type 1 cells. A: representative cell-attached patch-clamp recording obtained from type 1 cell accessed in situ. EGF (10 ng/ml) added to patch solution following control recording period (#). B: portion of trace from A enlarged to clearly show that channels spend less time in closed state (indicated by dashed line extending from arrow pointing to closed state) following EGF treatment; NSCs with a 22-pS conductance are shown. C: EGF acutely increased ENaC NPo values from 0.40 ± 0.15 to 0.60 ± 0.23; *P < 0.05; n = 7. D: the open probability (Po) of type 1 cells examined did not change significantly following EGF treatment. E: EGF increases ENaC NPo via significant changes in the number of active channels (N) in the membrane.
Fig. 11.
Fig. 11.
Acute increases in ENaC following EGF treatment in type 2 cells. A: representative cell-attached patch-clamp recording of type 2 cell accessed in situ. EGF was added to bath media (as indicated near # in continuous patch), which led to immediate increases in channel activity. B: enlarged portions of continuous trace to show detail of channels under control and EGF treatment; representative channel shown has a 10-pS conductance. C: in type 2 cells, ENaC NPo values significantly increased from 0.48 ± 0.21 to 0.91 ± 0.28 (P < 0.05; n = 10) following EGF stimulation. D: EGF significantly altered the Po of type 2 cells examined and had no effect on the number of active channels in the cell membrane (E).
Fig. 12.
Fig. 12.
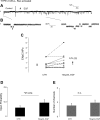
Sequestering O2 abrogates EGF-induced changes in ENaC activity. In continuous patch-clamp recordings, type 1 (A) and type 2 cells (B) were treated with 10 ng/ml EGF after 250 μM 2,2,6,6-tetramethylpiperidine-N-oxyl (TEMPO) treatment. Sequestering O2 in type 1 cells significantly decreased ENaC activity [from 0.40 ± 0.18 to 0.06 ± 0.05 (in the presence of EGF); P = 0.03; n = 3] and also prevented EGF-induced increases. TEMPO-treated type 2 cells did not respond significantly to EGF treatment in 10 independent observations.

Similar articles

Cited by

References

    1. Bedard K, Krause KH. The NOX family of ROS-generating NADPH oxidases: physiology and pathophysiology. Physiol Rev 87: 245–313, 2007 - PubMed
    1. Berdiev BK, Qadri YJ, Benos DJ. Assessment of the CFTR and ENaC association. Mol Biosyst 5: 123–127, 2009 - PMC - PubMed
    1. Borok Z, Liebler JM, Lubman RL, Foster MJ, Zhou B, Li X, Zabski SM, Kim KJ, Crandall ED. Na transport proteins are expressed by rat alveolar epithelial type I cells. Am J Physiol Lung Cell Mol Physiol 282: L599–L608, 2002 - PubMed
    1. Borok Z, Danto SI, Lubman RL, Cao Y, Williams MC, Crandall ED. Modulation of T1α expression with alveolar epithelial cell phenotype in vitro. Am J Physiol Lung Cell Mol Physiol 275: L155–L164, 1998 - PubMed
    1. Dise RS, Frey MR, Whitehead RH, Polk DB. Epidermal growth factor stimulates Rac activation through Src and phosphatidylinositol 3-kinase to promote colonic epithelial cell migration. Am J Physiol Gastrointest Liver Physiol 294: G276–G285, 2008 - PubMed

Publication types

MeSH terms