. 2010 Mar 19;285(12):9041-53.
doi: 10.1074/jbc.M109.075358. Epub 2010 Jan 22.

Drosophila octamer elements and Pdm-1 dictate the coordinated transcription of core histone genes

Affiliations

Drosophila octamer elements and Pdm-1 dictate the coordinated transcription of core histone genes

Mei-Chin Lee et al. J Biol Chem. .

Abstract

We reveal a set of divergent octamer elements in Drosophila melanogaster (dm) core histone gene promoters. These elements recruit transcription factor POU-domain protein in D. melanogaster 1 (Pdm-1), which along with co-activator dmOct-1 coactivator in S-phase (dmOCA-S), activates transcription from at least the Drosophila histone 2B (dmH2B) and 4 (dmH4) promoters in a fashion similar to the transcription of mammalian histone 2B (H2B) gene activated by octamer binding transcription factor 1 (Oct-1) and Oct-1 coactivator in S-phase (OCA-S). The expression of core histone genes in both kingdoms is coordinated; however, although the expression of mammalian histone genes involves subtype-specific transcription factors and/or co-activator(s), the expression of Drosophila core histone genes is regulated by a common module (Pdm-1/dmOCA-S) in a directly coordinated manner. Finally, dmOCA-S is recruited to the Drosophila histone locus bodies in the S-phase, marking S-phase-specific transcription activation of core histone genes.


Figures

FIGURE 1.
FIGURE 1.
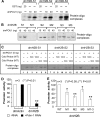
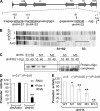
Three pivotal octamer elements for the Pdm-1 anchorage to the dmH2B promoter. A, depicted on top is a D. melanogaster histone genes cluster (∼5 kb) on chromosome 2L, with transcriptional directions of the genes indicated by arrows. Illustrated below are details of the dmH2B promoter, with octamer positions (relative to the transcription start site) indicated with arrows, and sequences (from distal to proximal, dmH2B-S1, dmH2B-S2, and dmH2B-S3) underlined. B, shown is bacterially expressed GST-Pdm-1 POU domain fusion protein (dmPOU1). Whole cell lysates (WCL) of the host XA90 Escherichia coli strain from the control and isopropyl 1-thio-β-d-galactopyranoside-induced samples were assessed for protein production (staining of the SDS-gel-resolved proteins with Coomassie Blue). Lane 3 shows the purified protein. C, shown is a footprint analysis of the promoter region of the dmH2B gene without (lane 3) or with 1 μg dmPOU1 (lane 2). The protected regions that cover dmH2B-S1, -S2, and -S3 sites are indicated. D, sequences of the dmH2B-S1, -S2, and -S3 octamer sites (uppercase) are shown. Oligonucleotides encompassing individual sites were end-labeled with 33P and used in EMSAs. Base-substituted oligonucleotides (M1, M2, and M3) are indicated with mutated residues underlined. E, sequences of the dmH4-S1+S2 and -S3 octamer sites (uppercase) are shown. Base-substituted oligonucleotides (M1, M2, and M3) are indicated with the mutated residues underlined. These oligonucleotides were used in later EMSAs (Fig. 6C).
FIGURE 2.
FIGURE 2.
Sequence-specific interaction of Pdm-1 with dmH2B octamer elements dictating dmH2B transcription. A, EMSAs using dmH2B octamer-containing probes with either GST-dmPOU1 or, as a control, GST are shown. B, oligonucleotide probes containing wild-type or mutant (M) dmH2B-S1, -S2, or -S3 site were EMSA-analyzed. C, shown are oligonucleotide probes containing wild-type dmH2B-S1, -S2, or -S3 site were EMSA-analyzed in the absence or presence of a 50- or 100-fold molar excess of non-labeled oligonucleotides that contained either wild-type or mutant (MT) octamer sites. D, luciferase reporter assays are shown of the dmH2B or the dmAct5C promoter in S2 cells treated without or with 37 nm Pdm-1-specific dsRNA for 72 h. E, shown are luciferase reporter assays on the wild-type versus the mutant dmH2B promoters.
FIGURE 3.
FIGURE 3.
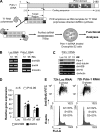
RNAi-mediated silencing of Pdm-1 down-regulates dmH2B expression. A, shown is a dsRNA-mediated Pdm-1 RNAi strategy. Depicted is the Pdm-1 cDNA; the POU domain with POU specific (PS) and POU homeo (PH) subdomains along with the linker (L) region is shown. DNA corresponding to the first 700 bases of the coding sequence was PCR-amplified, which incorporated the T7 promoter on both ends. Then dsRNA was synthesized using T7 RNA polymerase, purified and used to treat Drosophila S2 cells. B, shown is a time course. S2 cells were treated with 37 nm luciferase dsRNA (left panel) or Pdm-1 dsRNA (right panel) for 72 or 96 h. mRNA levels of dmH2B, dmH4, and dmActin were assessed by RT-rPCR. C, shown is a dose response. S2 cells were treated with the indicated doses of Pdm-1 dsRNA or 37 nm luciferase dsRNA for 72 h. Pdm-1 and dmβ-tubulin protein levels were determined by immunoblot (upper panel), and dmH2B, dmH4, and dmActin mRNA levels were scored by RT-PCR (lower panel). D, quantification is shown of dmH2B and dmH4 expression in Pdm-1-silenced S2 cells using RT-qPCR. E, shown are cell cycle profiles of cells treated with luciferase- or Pdm-1-specific dsRNA (37 nm, 72 h). FITC, fluorescein isothiocyanate.
FIGURE 4.
FIGURE 4.
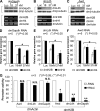
Repressed dmH2B and dmH4 expression by elimination of a dmOCA-S function in vivo. A–C, shown are dmH2B and dmH4 mRNA levels (lower panels) upon RNAi that targeted luciferase or selective dmOCA-S components (upper panels). S2 cells were treated with 37 nm luciferase-specific dsRNA or 18 or 37 nm dmGapdh-specific (A; 5 days), dmLdh-specific (B; 3 days), and Awd-specific (C; 3 days) dsRNA. D–F correspond to A–C lower panels but show dmH2B and dmH4 expression quantification by real-time PCR. G, luciferase reporter assays are shown. S2 cells fed without or with 37 nm dmOCA-S-specific dsRNAs for 48 h (Awd, dmLdh) or 96 h (dmGapdh) were transfected with dmH2B- or dmAct5C-promoter-luciferase reporter genes. After 24 more hours, cell lysates were assayed for luciferase activities. N.S., not significant.
FIGURE 5.
FIGURE 5.
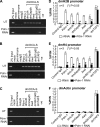
dmH2B and dmH4 promoter ChIP assays. Assays were performed on S2 cells treated without (UT) or with 37 nm Pdm-1-specific dsRNA using indicated ChIP-quality antibodies. A–C, shown are recovered DNA was used for PCR amplification with primers specific for the dmH2B (A), dmH4 (B), and dmActin (C) promoters. -Ve, negative control for PCR. D–F, ChIP assays were quantified by real-time PCR. The efficacies of respective promoter DNA recovery after immunoprecipitations (IP) are expressed as percentages of the (sheared) input (IN) chromatin. Panels D–F correspond to panels A–C.
FIGURE 6.
FIGURE 6.
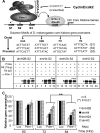
The dmH4 promoter is also a direct target for the Pdm-1/dmOCA-S regulatory module. A, a schematic of dmH4 promoter, illustrated with the octamer positions (relative to the transcription start site) is indicated with arrows and sequences (from distal to proximal, dmH4-S1, dmH4-S2, and dmH4-S3) underlined. B, a footprinting analysis exhibits dmPOU1-protected (from DNase I digestion) regions corresponding to dmH4-S1+S2 and dmH4-S3 sites on the dmH4 promoter. C, shown are EMSAs using the wild-type dmH4-S1+S2 and dmH4-S3 probes and the corresponding dmH4-M1, -M2, -M3 mutants (shown in Fig. 1E). The dmH4-S1 and -S2 sites are very tightly linked (A and B); we did not assay them in separate probes here. This close proximity of the two binding sites might pose a stereo-hindrance for double occupancy by dmPOU1 at least in vitro; nevertheless, both sites along with S3 significantly contribute to the overall promoter activity when individually tested (see E). D, shown are luciferase reporter assays of the dmH4 or the dmAct5C promoter in S2 cells treated without or with 37 nm Pdm-1-specific dsRNA for 72 h. E, shown are luciferase reporter assays on the wild-type versus the mutant dmH4 promoters.
FIGURE 7.
FIGURE 7.
Pdm-1 as a universal transcription factor connecting dmOCA-S to Drosophila core histone gene promoters. A, shown is a transcriptional regulation pathway of D. melanogaster core histone genes. All the core histone genes contain multiple octamer sites in their promoters for recruitment of the common transcription factor Pdm-1, which in turn recruits dmOCA-S that might well be the universal co-activator for the coordinated expression of all Drosophila core histone genes. B, EMSAs analyses are shown using crude nuclear extract (NE) and oligos containing the H2B, H4, H2A, and H3 S2 sites, which formed one major complex (arrowhead; lanes 3, 8, 13, and 18). Naïve rabbit IgG as control did not supershift the complex formed between nuclear extract and probe (lanes 4, 9, 14, and 19); however, rabbit anti-Pdm-1 antibodies produced a supershifted complex (*), hence, demonstrating that the complex contained native endogenous Pdm-1 transcription factor (lanes 5, 10, 15, and 20). Note that, for space considerations the images of the gel portions containing free probes are not shown here as well as in the EMSAs in Figs. 2 and 6. C, core histone gene expression in a time course is shown. Schneider-2 (S2) cells were treated with 37 nm luciferase- or Pdm-1-specific dsRNA and harvested at 60, 72, and 84 h for expression analyses of dmH2A, dmH2B, dmH3, and dmH4 core histone genes using quantitative RT-qPCR.
FIGURE 8.
FIGURE 8.
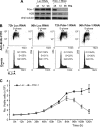
Physiological effects of Pdm-1 RNAi cells. A, shown are Western analyses of Pdm-1 RNAi-treated cells showing time-dependent down-regulation of Pdm-1 and dmH2B protein levels. The lagged deficiency of dmH2B protein expression (96 h) as compared with that of dmH2B mRNA expression (72 h; Fig. 7C) might suggest increased stabilities of preexisting histone proteins in dmOCA-S-deficient cells. B, cell cycle profiles at 72 and 96 h post-Pdm-1 and control RNAi, showing prominent cell cycle defects at 96 h in Pdm-1-silenced cells. The obvious sharp reduction of G2-phase cells is in principle a function of disallowance of significant number of S-phase cells to exit into G2-phase, presumably attributed to a shortage of histone proteins beyond 72 h (see A). Thus, a significant number of cells are retarded in the S-phase; there is ongoing DNA replication, thus BrdUrd incorporation, but it must be with a much-reduced rate in concert with histone proteins shortage. On the other hand, cells already in G2-phase before manifestation of histone expression defects would progress into the G1-phase. These cells, however, would have difficulty to enter S-phase due to a shortage of histone proteins, thus, the increase in the number/percentage of G1-phase cells. FITC, fluorescein isothiocyanate. C, the trypan blue exclusion assays indicated that cell viability was reduced at 84 h, which became more prominent when monitored from 96 h and beyond.
FIGURE 9.
FIGURE 9.
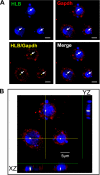
Confocal immunofluorescence analysis of HLB foci in cells synchronized at the early S-phase. A, double staining for dmGapdh (red) and HLB (green) is shown. Cell nuclei were counterstained with 4′,6-diamidino-2-phenylindole (DAPI, blue). B, the image represents the z-stack projection of 17 confocal sections (stack z-spacing, 0.44 μm), showing both XZ and YZ sections. Nuclear dmGapdh was co-localized with HLB (arrowheads). Scale bar, 5 μm.
FIGURE 10.
FIGURE 10.
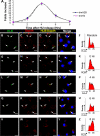
dmOCA-S is recruited to Drosophila histone locus bodies during S-phase. A, shown is a time course graph following dmH2B and dmH4 levels of S2 cells from early S-phase to G2-phase. Cells were harvested at 0, 2, 4, 6, and 8 h after release from synchronization and assayed for dmH2B and dmH4 mRNA levels by quantitative RT-qPCR. B–E, random cells images are shown. F, shown are cell cycle profiles of random cells; ∼20% of the cells were in the S-phase. A similar percentage was obtained when counting 100 randomly picked cells using HLB-foci-staining as a criterion. G–J, early S-phase cells images show weak HLB foci and co-localization with nuclear dmGapdh. K, early S-phase cell cycle profiles are shown. L–O, mid-S-phase cells images show prominent HLB foci with strong co-localization with nuclear dmGapdh foci. P, mid-S-phase cell cycle profiles are shown. Q–T, late S- and early G2-phase cells images show decreased nuclear dmGapdh and HLB foci in size and number. U, late S- and early G2-phase cell cycle profiles are shown. V–Y, shown are G2-phase cells, with no HLB and dmGapdh nuclear foci. Z, G2-phase cell cycle profiles are shown. When appropriate, arrows indicate HLB (B, G, L, Q, and V) and nuclear dmGapdh (C, H, M, R, and W) foci and their nuclear co-localization (D, I, N, S, and X), which was confirmed by superimposing to 4′,6-diamidino-2-phenylindole (DAPI) nuclei-staining images (E, J, O, T, and Y). HLB foci were stained with the MPM-2 antibody; nuclear dmGapdh foci were stained by anti-p38/GAPDH antibodies. The images and cell cycle profiles of cells at the 2-h time point were similar to those at the 0 h (G–K) and were not shown for space considerations; we reason that cells need certain time to recover from the replication stress imposed by HU. Bar, 10 μm.

Similar articles

Cited by

References

    1. Roeder R. G. (2003) Nat. Med. 9, 1239–1244 - PubMed
    1. Hentschel C. C., Birnstiel M. L. (1981) Cell 25, 301–313 - PubMed
    1. Wang Z. F., Krasikov T., Frey M. R., Wang J., Matera A. G., Marzluff W. F. (1996) Genome Res. 6, 688–701 - PubMed
    1. Marzluff W. F., Duronio R. J. (2002) Curr. Opin. Cell Biol. 14, 692–699 - PubMed
    1. Marzluff W. F., Gongidi P., Woods K. R., Jin J., Maltais L. J. (2002) Genomics 80, 487–498 - PubMed

Publication types

LinkOut - more resources