. 2010 Apr 2;285(14):10487-96.
doi: 10.1074/jbc.M109.066563. Epub 2010 Jan 22.

The neurosecretory vesicle protein phogrin functions as a phosphatidylinositol phosphatase to regulate insulin secretion

Affiliations

The neurosecretory vesicle protein phogrin functions as a phosphatidylinositol phosphatase to regulate insulin secretion

Leslie A Caromile et al. J Biol Chem. .

Abstract

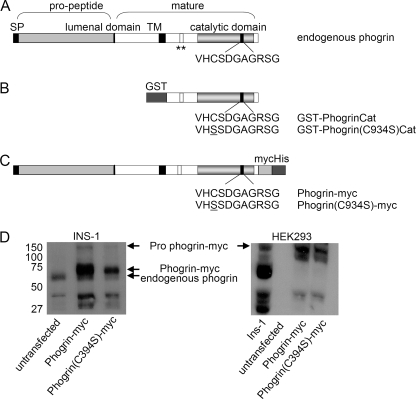
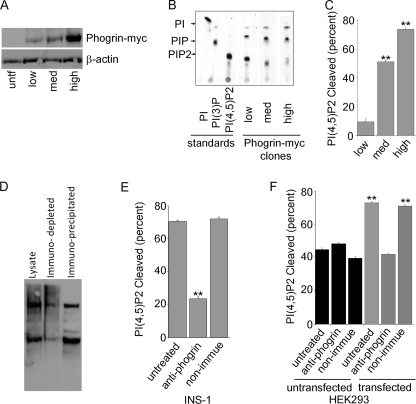
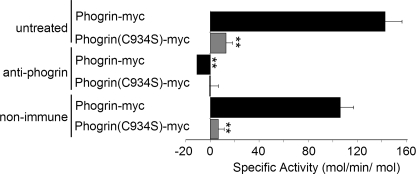
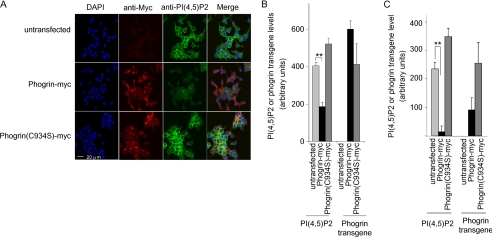
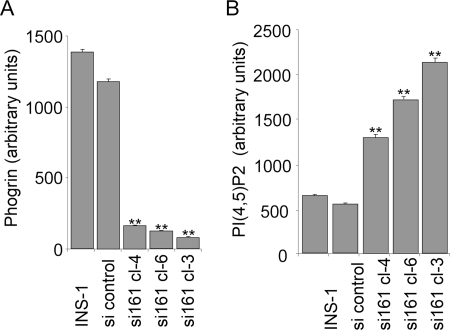
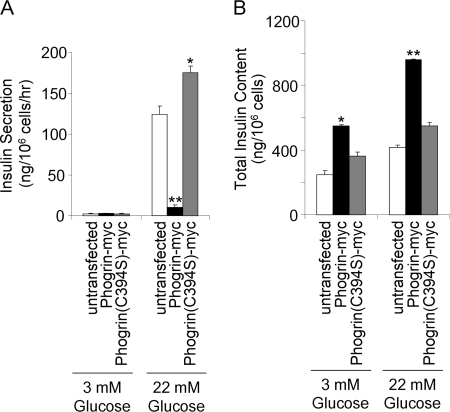
Phogrin is a transmembrane protein expressed in cells with stimulus-coupled peptide hormone secretion, including pancreatic beta cells, in which it is localized to the membrane of insulin-containing dense-core vesicles. By sequence, phogrin is a member of the family of receptor-like protein-tyrosine phosphatases, but it contains substitutions in conserved catalytic sequences, and no significant enzymatic activity for phogrin has ever been reported. We report here that phogrin is able to dephosphorylate specific inositol phospholipids, including phosphatidylinositol (PI) 3-phosphate and PI 4,5-diphosphate but not PI 3,4,5-trisphosphate. The phosphatidylinositol phosphatase (PIPase) activity of phogrin was measurable but low when evaluated by the ability of a catalytic domain fusion protein to hydrolyze soluble short-chain phosphatidylinositol phospholipids. Unlike most PIPases, which are cytoplasmic proteins that associate with membranes, mature phogrin is a transmembrane protein. When the transmembrane form of phogrin was overexpressed in mammalian cells, it reduced plasma membrane phosphatidylinositol 4,5-disphosphate levels in a dose-dependent manner. When purified and assayed in vitro, the transmembrane form had a specific activity of 142 mol/min/mol, 75-fold more active than the catalytic domain fusion protein and comparable with the specific activities of the other PIPases. The PIPase activity of phogrin depended on the catalytic site cysteine and correlated with effects on glucose-stimulated insulin secretion. We propose that phogrin functions as a phosphatidylinositol phosphatase that contributes to maintaining subcellular differences in levels of PIP that are important for regulating stimulus-coupled exocytosis of insulin.


Figures

FIGURE 1.
FIGURE 1.
Structure of endogenous phogrin and fusion proteins. A, shown is a diagram of endogenous rat phogrin showing the major structural domains. Phogrin is synthesized as an ∼130-kDa transmembrane pro-form that includes a signal peptide (SP), lumenal domain, transmembrane domain (TM), and cytoplasmic catalytic domain. The N-terminal portion of the lumenal domain is cleaved during maturation such that the N-terminal portion (pro-peptide) is released into the lumen of the DCV. Mature phogrin is a 60/64-kDa transmembrane protein with a short lumenal domain and a PTPase-like cytoplasmic domain. Serine 680 and threonine 699 (location indicated by **) between TM and catalytic domains are sites of phosphorylation by protein kinase A (68, 69). B, the structure of GST-phogrinCat and GST-phogrin(C934S)Cat constructs expressed in bacteria is shown. C, shown is the structure of phogrin-myc and phogrin(C934S)-myc constructs expressed in mammalian cells. D, INS-1 and HEK293 cells were infected with retroviral constructs encoding phogrin-myc and phogrin(C934S)-myc and selected with puromycin. Cell lysates were evaluated by Western blot using a phogrin-specific rabbit antibody. In Ins-1 cells arrows indicate the ∼130-kDa pro-form and 73/77-kDa mature forms of phogrin-myc and the 60/64-kDa mature form of endogenous phogrin. The pro-form of endogenous phogrin is not present at a high enough level to be detected in this exposure. HEK293 cells do not express endogenous phogrin and phogrin-myc accumulates as unprocessed pro-form.
FIGURE 2.
FIGURE 2.
Evaluation of the PIPase activity of phogrin-myc by thin layer chromatography. A mass culture of INS-1 cells infected with phogrin-myc vector was plated at low density, and 10 individual clones were picked and evaluated by Western blot. From these 10 clones, 3 clones expressing low, medium, or high levels of phogrin-myc were chosen for further evaluation and use. A, shown is a Western blot of cell extracts probed with anti-myc and with anti-β-actin as a loading control. untf, untransfected. B, BODIPY-FL di-C6 phosphoinositides were distinguished by thin layer chromatography as described under “Experimental Procedures.” The first three lanes show the chromatographic mobility of 1 μg of fluorescent PIP standards. The final three lanes show the products of 1 μg of PI(4,5)P2 incubated for 5 min at 37 °C with 5 μg of lysate protein from the INS-1 clones expressing low, medium, or high levels of phogrin-myc. C, shown is a densitometric quantitation of a chromatographic analysis performed as for panel B and plotted as the percentage of fluorescent PI(4,5)P2 cleaved at the end of the incubation period; data are the average ±S.E. of triplicate determinations. Data were analyzed by ImageQuant software. **, p < 0.01 compared with the low-expressing clone. D, lysates from the INS-1 clone expressing the highest level of phogrin-myc were incubated for 3 h with anti-phogrin serum or non-immune serum followed by 1 h of incubation with protein A and then centrifugation to pellet bound protein. A Western blot probed with anti-phogrin shows immunodepletion of mature and precursor forms of phogrin (endogenous phogrin and phogrin-myc) from the INS-1 transfected clone. E, the control and immunodepleted lysates were assayed for cleavage of fluorescent-PI(4,5)P2 as for panel B. **, p < 0.01 compared with untreated. F, lysates from control HEK293 cells or from HEK293 cells expressing phogrin-myc were immunodepleted with control or anti-phogrin antiserum as for panel C and evaluated for the ability to cleave fluorescent PI(4,5)P2. Anti-phogrin did not affect the basal PIPase activity in HEK293 lysates and eliminated all of the additional PIPase activity contributed by phogrin-myc expression. **, p < 0.01 compared with untreated untransfected.
FIGURE 3.
FIGURE 3.
Affinity-purified phogrin-myc has PIPase activity. Triton X-100 lysates of INS-1 cells expressing phogrin-myc or phogrin(C934S)-myc were incubated with Ni-NTA magnetic- agarose beads to bind phogrin-myc via the C-terminal poly-His tag. The beads were washed, and the bound phogrin-myc eluted as described under “Experimental Procedures.” The amount of phogrin-myc in the eluate was determined by Western blot with rabbit anti-phogrin catalytic domain antibody using dilutions of purified GST-phogrinCat as standards. Aliquots containing 0.6 μg of phogrin-myc or phogrin(C934S)-myc were incubated with rabbit anti-phogrin IgG or control non-immune IgG then assayed for hydrolysis of 100 μm diC8-PI(4,5)P2. Phosphate release was measured using the malachite green assay and normalized to the amount of phogrin transgene present (mean ± S.E. of triplicate determinations). **, p < 0.01 compared with the activity of untreated phogrin-myc samples.
FIGURE 4.
FIGURE 4.
Phogrin-myc expression decreases PI(4,5)P2 levels in cells. Transfected or untransfected INS-1 cells (panels A and B) or HIK293 cells (panel C) were cultured in medium with 11.1 mm glucose, fixed with cold formalin, permeabilized with cold methanol, and incubated with mouse monoclonal anti-myc IgG visualized with TRITC-conjugated goat anti-mouse IgG (red) and with mouse monoclonal IgM anti-PI(4,5)P2 visualized with FITC-conjugated goat anti-mouse IgM (green). Nuclei were stained with 4′,6-diamidino-2-phenylindole (DAPI, blue). A, representative confocal images of INS-1 cells are shown. Expression of phogrin-myc, but not phogrin(C934S)-myc, substantially decreased the levels of PI(4,5)42. B, to quantitate the levels of transgene and PI(4,5)P2 in INS-1 cells, images were evaluated by Zeiss LSM Image Analysis software as described under “Experimental Procedures.” At least 3 low power fields (no fewer than 20 cells/field) were evaluated for each condition, and fluorescence intensity was normalized to the numbers of cells per field based on numbers of nuclei stained with 4′,6-diamidino-2-phenylindole. The data are presented as the means ± S.D. of triplicate determinations. Comparable results were obtained in five experiments. **, p < 0.01 compared with untransfected. C, HEK293 cells expressing phogrin-myc or phogrin(C934S)-myc were evaluated as for panels A and B. The data are presented as the means ± S.D. of five fields/condition. Comparable results were obtained in three experiments. **, p < 0.01 compared with untransfected.
FIGURE 5.
FIGURE 5.
Reducing endogenous phogrin levels by SI-knockdown increases PI(4,5)P2 levels in INS-1 cells. Anti-phogrin construct si161 or a control sequence was transfected into INS-1 cells, and three clones were picked for evaluation by immunostaining, confocal microscopy, and quantitation of expression levels by image analysis as described for Fig. 4. A, endogenous phogrin was detected using rabbit antiserum against the lumenal domain of mature phogrin and visualized with TRITC-labeled donkey anti-rabbit IgG. B, PI(4,5)P2 was detected using mouse monoclonal IgM anti-PI(4,5)P2 visualized with FITC-conjugated goat anti-mouse IgM. The data are presented as the means ± S.D. of triplicate determinations. Comparable results were obtained in three experiments. **, p < 0.01 compared with untransfected INS-1.
FIGURE 6.
FIGURE 6.
Inhibition of glucose-stimulated insulin secretion by phogrin-myc depends on its PIPase activity. A, cultures of INS-1 cells were incubated for 1 h in RPMI without glucose then for 1 h in Krebs-Ringer bicarbonate-HEPES buffer with 3 or 22.2 mm glucose or 3 or 22.2 mm mannitol (not shown) as negative controls for possible osmotic effects (none were seen). Insulin released into the KRBH was determined by enzyme-linked immunosorbent assay and expressed as ng/106 cells/h. Expression of phogrin-myc, but not phogrin(C934S)-myc, reduced insulin secretion by about 90%. B, after collecting the supernatant, cells were washed and lysed, and insulin content was determined by enzyme-linked immunosorbent assay and normalized to cell number determined from parallel cultures. *, p < 0.05; **, p < 0.01 compared with untransfected.

Similar articles

Cited by

References

    1. Bonifacio E., Lampasona V., Bingley P. J. (1998) J. Immunol. 161, 2648–2654 - PubMed
    1. Lan M. S., Wasserfall C., Maclaren N. K., Notkins A. L. (1996) Proc. Natl. Acad. Sci. U.S.A. 93, 6367–6370 - PMC - PubMed
    1. Lu J., Li Q., Xie H., Chen Z. J., Borovitskaya A. E., Maclaren N. K., Notkins A. L., Lan M. S. (1996) Proc. Natl. Acad. Sci. U.S.A. 93, 2307–2311 - PMC - PubMed
    1. Dirkx R., Jr., Hermel J. M., Rabin D. U., Solimena M. (1998) Adv. Pharmacol. 42, 243–246 - PubMed
    1. Lan M. S., Lu J., Goto Y., Notkins A. L. (1994) DNA Cell Biol. 13, 505–514 - PubMed

Publication types

MeSH terms