. 2010 Apr 2;285(14):10508-18.
doi: 10.1074/jbc.M109.067298. Epub 2010 Jan 22.

The role of potassium in inflammasome activation by bacteria

Affiliations

The role of potassium in inflammasome activation by bacteria

Cecilia S Lindestam Arlehamn et al. J Biol Chem. .

Abstract

Many Gram-negative bacteria possess a type III secretion system (TTSS( paragraph sign)) that can activate the NLRC4 inflammasome, process caspase-1 and lead to secretion of mature IL-1beta. This is dependent on the presence of intracellular flagellin. Previous reports have suggested that this activation is independent of extracellular K(+) and not accompanied by leakage of K(+) from the cell, in contrast to activation of the NLRP3 inflammasome. However, non-flagellated strains of Pseudomonas aeruginosa are able to activate NLRC4, suggesting that formation of a pore in the cell membrane by the TTSS apparatus may be sufficient for inflammasome activation. Thus, we set out to determine if extracellular K(+) influenced P. aeruginosa inflammasome activation. We found that raising extracellular K(+) prevented TTSS NLRC4 activation by the non-flagellated P. aeruginosa strain PA103DeltaUDeltaT at concentrations above 90 mm, higher than those reported to inhibit NLRP3 activation. Infection was accompanied by efflux of K(+) from a minority of cells as determined using the K(+)-sensitive fluorophore PBFI, but no formation of a leaky pore. We obtained exactly the same results following infection with Salmonella typhimurium, previously described as independent of extracellular K(+). The inhibitory effect of raised extracellular K(+) on NLRC4 activation thus reflects a requirement for a decrease in intracellular K(+) for this inflammasome component as well as that described for NLRP3.


Figures
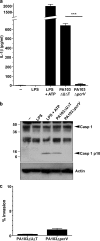
FIGURE 1.
FIGURE 1.
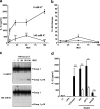
Activation of the inflammasome by P. aeruginosa is dependent on a functional type III secretion system but not on translocated toxins. Murine BMDM were treated with LPS for 3 h alone, or in addition ATP for 30 min. Infections with the indicated strains of P. aeruginosa were for 90 min at an MOI of 100 in the absence of LPS prestimulation. a shows secreted IL-1β released into the medium immediately following incubation. Columns are means (n = 3); error bars are S.E. of replicates. *** indicates a significant difference from the PA103ΔUΔT strain, p < 0.001, Student's t test. b shows caspase-1 processing detected by immunoblot of cell lysates treated as indicated. Arrows to the right indicate unprocessed caspase-1 (Casp 1) and the processed p10 subunit (Casp 1 p10). Molecular mass markers (kDa) are shown to the left. The lower panel shows the blot reprobed with an antibody to actin to show even loading of the gel. c, internalized bacteria do not differ significantly between the PA103ΔUΔT and PA103ΔpcrV. BMDM were infected at a MOI of 100 for 90 min and then gentamicin added for an additional 30 min to kill extracellular bacteria. Cells were then lysed and intracellular bacteria counted following culture. Results are means of triplicates; error bars are ± S.E. There is no significant difference between the strains (p > 0.05, Student's t test).
FIGURE 2.
FIGURE 2.
P. aeruginosa activation of the inflammasome is inhibited by high extracellular potassium, independently of MOI. a–c, LPS pretreated murine BMDM were infected for 90 min with PA103ΔUΔT at the indicated MOIs, either in medium with physiological [K+] (5 mm, square symbols) or with elevated [K+] (140 mm, triangles). a shows secreted IL-1β released into the medium at different MOIs and [K+]. Points are the means of triplicates; error bars are ± S.E. IL-1β release was significantly dependent on both [K+] and MOI by 2-way ANOVA (p < 0.001 and p < 0.001, respectively). The difference in IL-1β release was significant for all [K+] using the Bonferroni post-test correction (**, p < 0.01; ***, p < 0.0001). b, cell viability measured by LDH release in the same experiment as in a, with the same symbols. c, shows caspase-1 processing detected by immunoblot of cell lysates following infection at different MOIs as indicated in low (5 mm) and high (140 mm) extracellular potassium concentration. Arrows to the right indicate unprocessed caspase-1 (Casp 1) and the processed p10 subunit (Casp 1 p10). d, shows released IL-1β following murine BMDM treatment with LPS or LPS + ATP or following infection with the indicated strains of P. aeruginosa PAO1 at a MOI of 30. Solid bars are means of triplicates in low (5 mm) [K+] medium; open bars are in high extracellular (140 mm) [K+]. Error bars are ± S.E. Released IL-1β was significantly higher in the low [K+] medium as shown (**, p < 0.01; *, p < 0.05; Student's t test).
FIGURE 3.
FIGURE 3.
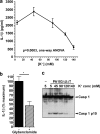
Extracellular potassium concentration-dependent inhibition of inflammasome activation by P. aeruginosa. a, LPS-pretreated murine BMDM were infected with PA103ΔUΔT at an MOI of 30 at the indicated extracellular potassium concentrations. Each point is the mean of triplicate determinations; error bars are ± S.E. Variation in IL-1β with potassium concentration was significant (p = 0.0003, 1-way ANOVA with significant linear trend for decrease in IL-1β with increasing extracellular potassium, slope −455.7, p < 0.001). b, effect of glybenclamide on IL-1β release from LPS-pretreated BMDM following PA103ΔUΔT infection at a MOI of 30. c, caspase-1 processing detected by immunoblot of cell lysates following infection at different extracellular potassium concentrations as in a. Arrows to the right indicate unprocessed caspase-1 (Casp 1) and the processed p10 subunit (Casp 1 p10).
FIGURE 4.
FIGURE 4.
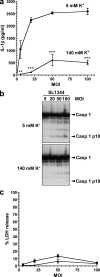
S. typhimurium activation of the inflammasome is inhibited by high extracellular potassium, independently of MOI. a–c, LPS pretreated murine BMDM were infected for 90 min with S. typhimurium strain SL1344 at the indicated MOIs, either in medium with physiological [K+] (5 mm, square symbols) or with elevated [K+] (140 mm, triangles). a, shows secreted IL-1β released into the medium at different MOIs and [K+]. Points are the means of triplicates; error bars are ± S.E. IL-1β release was significantly dependent on both [K+] and MOI by 2-way ANOVA (p < 0.001 and p < 0.001, respectively). The difference in IL-1β release was significant for all [K+] using the Bonferroni post-test correction (**, p < 0.01; ***, p < 0.0001). b shows caspase-1 processing detected by immunoblot of cell lysates following infection at different MOIs as indicated in low (5 mm) and high (140 mm) extracellular potassium concentration. Arrows to the right indicate unprocessed caspase-1 (Casp 1) and the processed p10 subunit (Casp 1 p10). c, cell viability measured by LDH release in the same experiment as in a, with the same symbols.
FIGURE 5.
FIGURE 5.
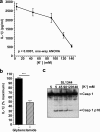
Extracellular potassium concentration-dependent inhibition of inflammasome activation by S. typhimurium. a, LPS-pretreated murine BMDM were infected with S. typhimurium strain SL1344 at a MOI of 30 at the indicated extracellular potassium concentrations. Each point is the mean of triplicate determinations; error bars are ± S.E. Variation in IL-1β with potassium concentration was significant (p < 0.0001, one-way ANOVA with significant linear trend for decrease in IL-1β with increasing extracellular potassium, slope −566.3, p < 0.001). b, effect of glybenclamide on IL-1β release from LPS-pretreated BMDM following SL1344 infection at a MOI of 30. c, caspase-1 processing detected by immunoblot of cell lysates following infection at different extracellular potassium concentrations as in a. Arrows to the right indicate unprocessed caspase-1 (Casp 1) and the processed p10 subunit (Casp 1 p10).
FIGURE 6.
FIGURE 6.
Extracellular potassium inhibition of bacterial inflammasome activation is independent of length of time after infection. LPS-pretreated murine BMDM were infected with either P. aeruginosa PA103ΔUΔT strain or S. typhimurium SL1344 at a MOI of 30 for the indicated times at either low (5 mm, filled bars) or high (140 mm, open bars) extracellular [K+]. In addition, gentamicin was added to the cultures where indicated after 60 min. Columns show means of triplicate determinations; error bars are ± S.E. Differences between high and low extracellular [K+] were significant where indicated (**, p < 0.05; **, p < 0.01; ***, p < 0.0001, Student's t test).
FIGURE 7.
FIGURE 7.
Intracellular potassium following bacterial infection and treatment with ATP. Murine BMDM were treated with ATP (inverted triangles) or infected at a MOI of 30 with P. aeruginosa PA103ΔUΔT strain (squares) or S. typhimurium SL1344 (triangles). Intracellular potassium was measured by flame photometry at the indicated times after treatment and expressed as nmol recovered per well containing 1 × 10⁶ cells. Results are means of 4–6 determinations; error bars ± S.E. ATP produced a significant fall in intracellular K+ concentration after 30 min (**, p < 0.01, Student's t test). Infection with either bacterium did not affect intracellular K+ concentration significantly (ns, non-significant: by t test of the final time point or difference of slope of the fitted line of linear regression from 0.0).
FIGURE 8.
FIGURE 8.
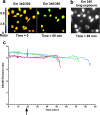
Individual cell measurements of intracellular potassium following infection with P. aeruginosa. Cells loaded with the dye PBFI were infected at 19.5 min with PA103ΔUΔT strain at a MOI of 30. Cells were visualized every 30 s by measuring observed fluorescence at 500 nm at excitation wavelengths of both 340 and 380 nm. a shows the ratio of this fluorescence intensity at the indicated time points as a pseudo-colorized image according to the color scale shown to the left. b shows the same image as in a at 89 min but only the 340 excitation emission at much higher gain. c shows the PBFI fluorescence emission ratio for four individual cells over time; cells were infected at the time indicted by the arrow. Similar results were found in 11 experiments as outlined in the results.
FIGURE 9.
FIGURE 9.
The P. aeruginosa type III secretion apparatus does not produce a leaky pore. a, RAW 264 murine macrophages were suspended in medium containing the fluorescent dye Lucifer yellow before treatment with ionomycin (5 μm) for 10 min, or infection with the indicated strains of PA103 at an MOI of 300 for 60 min. Following washing, entry of Lucifer yellow was detected by fluorescence microscopy (green fluorescence) and nuclei visualized by counterstaining with 4′,6-diamidino-2-phenylindole (DAPI) (blue). Images shown are representative of >300 cells analyzed. b, intracellular calcium concentration over time measured by Fluo-4 intensity in HeLa cells following treatment with 5 μm ionomycin (black line) or infection with PA103ΔUΔT (red line) or PA103ΔpcrV (blue line), both at an MOI of 150, at the arrow. Traces are integrated Fluo-4 mean fluorescence intensity (MFI) measured over an individual cell every 15 s. Identical traces were observed for >50 cells in each condition. c as in b but in cells infected with PA103ΔUΔT:ExoU. Three representative traces are shown out of more than 50 similar recordings. d, box and whisker plot showing the time to the onset of the calcium rise following infection with PA103ΔUΔT:ExoU. The box encloses the 25th to 75th percentile, with the line indicating the median value. The range is shown by the vertical bars. n = 10.

Similar articles

Cited by

References

    1. Bergsbaken T., Fink S. L., Cookson B. T. (2009) Nat. Rev. Microbiol. 7, 99–109 - PMC - PubMed
    1. Martinon F., Mayor A., Tschopp J. (2009) Annu. Rev. Immunol. 27, 229–265 - PubMed
    1. Yu H. B., Finlay B. B. (2008) Cell Host Microbe 4, 198–208 - PubMed
    1. Franchi L., Eigenbrod T., Muñoz-Planillo R., Nuñez G. (2009) Nat. Immunol. 10, 241–247 - PMC - PubMed
    1. Dinarello C. A. (2009) Annu. Rev. Immunol. 27, 519–550 - PubMed

Publication types

MeSH terms