

Glucose levels at the site of subcutaneous insulin administration and their relationship to plasma levels
- PMID: 20097778
- PMCID: PMC2845037
- DOI: 10.2337/dc09-1531
Glucose levels at the site of subcutaneous insulin administration and their relationship to plasma levels
Abstract
Objective: To examine insulin's effect on the tissue glucose concentration at the site of subcutaneous insulin administration.
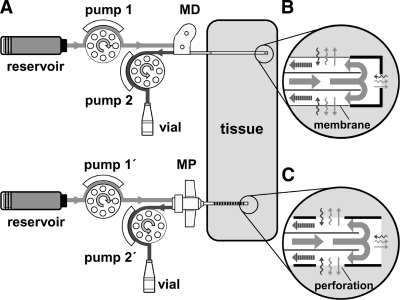
Research design and methods: A CMA-60 microdialysis (MD) catheter and a 24-gauge microperfusion (MP) catheter were inserted into the subcutaneous adipose tissue of fasting, healthy subjects (n = 5). Both catheters were perfused with regular human insulin (100 units/ml) over a 6-h period and used for glucose sampling and simultaneous administration of insulin at sequential rates of 0.33, 0.66, and 1.00 units/h (each rate was used for 2 h). Before and after the insulin delivery period, both catheters were perfused with an insulin-free solution (5% mannitol) for 2 h and used for glucose sampling only. Blood plasma glucose was clamped at euglycemic levels during insulin delivery.
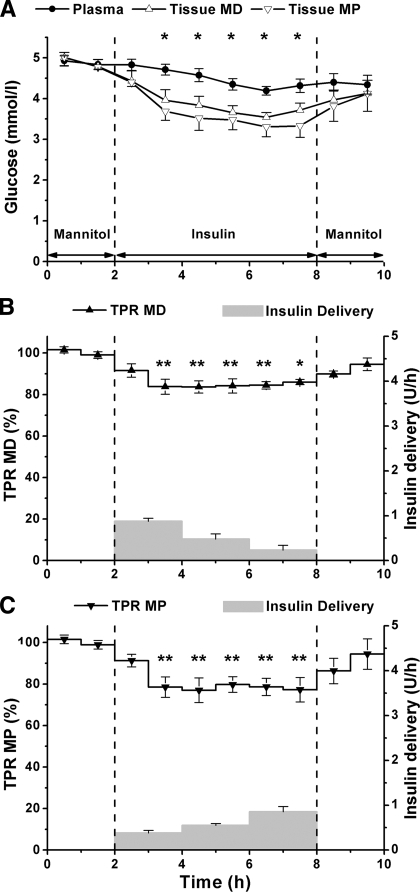
Results: Start of insulin delivery with MD and MP catheters resulted in a decline of the tissue glucose concentration and the tissue-to-plasma glucose ratio (TPR) for approximately 60 min (P < 0.05). However, during the rest of the 6-h period of variable insulin delivery, tissue glucose concentration paralleled the plasma glucose concentration, and the TPR for MD and MP catheters remained unchanged at 83.2 +/- 3.1 and 77.1 +/- 4.8%, respectively. After subsequent switch to insulin-free perfusate, tissue glucose concentration and TPR increased slowly and reattained preinsulin delivery levels by the end of the experiments.
Conclusions: The results show the attainment of a stable TPR value at the site of insulin administration, thus indicating that insulin delivery and glucose sensing may be performed simultaneously at the same adipose tissue site.
Figures
Similar articles
-
Can glucose be monitored accurately at the site of subcutaneous insulin delivery?J Diabetes Sci Technol. 2014 May;8(3):568-74. doi: 10.1177/1932296814522805. Epub 2014 Feb 18. J Diabetes Sci Technol. 2014. PMID: 24876621 Free PMC article. Review.
-
Use of the site of subcutaneous insulin administration for the measurement of glucose in patients with type 1 diabetes.Diabetes Care. 2010 Mar;33(3):595-601. doi: 10.2337/dc09-1532. Epub 2009 Dec 29. Diabetes Care. 2010. PMID: 20040654 Free PMC article. Clinical Trial.
-
Dose-response effect of a single administration of oral hexyl-insulin monoconjugate 2 in healthy nondiabetic subjects.Diabetes Care. 2004 Dec;27(12):2868-73. doi: 10.2337/diacare.27.12.2868. Diabetes Care. 2004. PMID: 15562199 Clinical Trial.
-
Oral vanadyl sulfate improves insulin sensitivity in NIDDM but not in obese nondiabetic subjects.Diabetes. 1996 May;45(5):659-66. doi: 10.2337/diab.45.5.659. Diabetes. 1996. PMID: 8621019 Clinical Trial.
-
Correlation between blood glucose concentration and glucose concentration in subcutaneous adipose tissue evaluated with microdialysis during intensive care.Scand J Clin Lab Invest. 2002;62(4):285-92. doi: 10.1080/003655102760145843. Scand J Clin Lab Invest. 2002. PMID: 12476927
Cited by
-
Clinical Recommendations for Managing the Impact of Insulin Adsorptive Loss in Hospital and Diabetes Care.J Diabetes Sci Technol. 2021 Jul;15(4):874-884. doi: 10.1177/1932296820915875. Epub 2020 Apr 24. J Diabetes Sci Technol. 2021. PMID: 32329372 Free PMC article.
-
Can glucose be monitored accurately at the site of subcutaneous insulin delivery?J Diabetes Sci Technol. 2014 May;8(3):568-74. doi: 10.1177/1932296814522805. Epub 2014 Feb 18. J Diabetes Sci Technol. 2014. PMID: 24876621 Free PMC article. Review.
-
A Glucose-Responsive Cannula for Automated and Electronics-Free Insulin Delivery.Adv Mater. 2024 Jul;36(27):e2403594. doi: 10.1002/adma.202403594. Epub 2024 Apr 29. Adv Mater. 2024. PMID: 38639424 Free PMC article.
-
Moving Toward a Unified Platform for Insulin Delivery and Sensing of Inputs Relevant to an Artificial Pancreas.J Diabetes Sci Technol. 2017 Mar;11(2):308-314. doi: 10.1177/1932296816682762. Epub 2016 Dec 13. J Diabetes Sci Technol. 2017. PMID: 28264192 Free PMC article. Review.
-
Periodic extraction of interstitial fluid from the site of subcutaneous insulin infusion for the measurement of glucose: a novel single-port technique for the treatment of type 1 diabetes patients.Diabetes Technol Ther. 2013 Jan;15(1):50-9. doi: 10.1089/dia.2012.0173. Epub 2012 Nov 5. Diabetes Technol Ther. 2013. PMID: 23126579 Free PMC article.
References
-
- Rizza RA, Mandarino LJ, Gerich JE. Dose-response characteristics for effects of insulin on production and utilization of glucose in man. Am J Physiol 1981;240:E630–E639 - PubMed
-
- Kono T, Barham FW. The relationship between the insulin-binding capacity of fat cells and the cellular response to insulin: studies with intact and trypsin-treated fat cells. J Biol Chem 1971;246:6210–6216 - PubMed
-
- Nesher R, Karl IE, Kipnis DM. Dissociation of effects of insulin and contraction on glucose transport in rat epitrochlearis muscle. Am J Physiol 1985;249:C226–C232 - PubMed
-
- Bonadonna RC, Saccomani MP, Seely L, Zych KS, Ferrannini E, Cobelli C, DeFronzo RA. Glucose transport in human skeletal muscle: the in vivo response to insulin. Diabetes 1993;42:191–198 - PubMed
Publication types
MeSH terms
Substances
LinkOut - more resources
Full Text Sources
Medical
