. 2010 Jan;22(1):34-47.
doi: 10.1105/tpc.109.072819. Epub 2010 Jan 22.

Cooperation of multiple chromatin modifications can generate unanticipated stability of epigenetic States in Arabidopsis

Affiliations

Cooperation of multiple chromatin modifications can generate unanticipated stability of epigenetic States in Arabidopsis

Tuncay Baubec et al. Plant Cell. 2010 Jan.

Abstract

Epigenetic changes of gene expression can potentially be reversed by developmental programs, genetic manipulation, or pharmacological interference. However, a case of transcriptional gene silencing, originally observed in tetraploid Arabidopsis thaliana plants, created an epiallele resistant to many mutations or inhibitor treatments that activate many other suppressed genes. This raised the question about the molecular basis of this extreme stability. A combination of forward and reverse genetics and drug application provides evidence for an epigenetic double lock that is only alleviated upon the simultaneous removal of both DNA methylation and histone methylation. Therefore, the cooperation of multiple chromatin modifications can generate unanticipated stability of epigenetic states and contributes to heritable diversity of gene expression patterns.


Figures
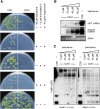
Figure 1.
Figure 1.
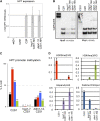
Treatments with DNA Methylation and Histone Deacetylase Inhibitors Do Not Release paTGS Silencing. (A) C2R and C2S1 seedlings grown on 10 μ g/mL hygromycin plates in the presence of 40 μ M ZEB and/or 1.6 μ M TSA. (B) RNA gel blot analysis indicates reactivation of the second noncoding transcript but not HPT mRNA after 20, 40, and 80 μ M ZEB treatments. (C) DNA gel blot analysis of DNA methylation after treatments with increasing zebularine concentrations using promoter-specific probes. [See online article for color version of this figure.]
Figure 2.
Figure 2.
Novel ddm1 and hog1 Mutant Alleles. (A) DDM1 gene region with indicated UTRs (white boxes), exons (filled boxes), and introns (lines). Functional domains are indicated by colored boxes, while mutations are indicated by insertions or deletions ( Δ ). Below: reading frame analysis in the ddm1 alleles. Coding sequence is indicated by the gray bar, and conserved SWI2/SNF2 signatures (Bork and Koonin, 1993) are shown below. White glyphs indicate potential translation initiation sites in the 5 ′ region (aa(A/G)(A/C)aAUGCcg; Rangan et al., 2008). Coding reading frames (in different colors) and encoded protein size are predicted in wild-type and mutant alleles. Light-gray bars indicate nonplant DNA insertions. (B) Allele comparison by hygromycin selection in analogous generations: F4 from crosses between C2S1 × ddm1-5 and M4 in the novel alleles. C2S1 and C2R are used as controls. (C) Mutant integration site in the SAHH/HOG1 gene. UTRs are indicated as white boxes, exons as filled boxes, and introns as lines. The four predicted splice variants are displayed (TAIR7). (D) Quantification of HOG transcript abundance in wild-type C2S1 and hog1-7 mutant plants normalized to EIF4A2. Error bars represent sd from triplicate analyses. Used primers are indicated by red arrows in (C).
Figure 3.
Figure 3.
Mutations in DDM1 and HOG1 Release paTGS from the HPT Transgene. (A) Quantification of HPT mRNA levels in wild-type, C2S1, C2R hog1-7,C2S1, and ddm1-12,C2S1 seedlings normalized to EIF4A2. Error bars represent sd from triplicate analyses. (B) p35S DNA methylation analysis in C2S1, C2R, and mutant plants by DNA gel blotting of DNA digested by methylation-sensitive restriction enzymes. (C) Promoter DNA methylation analysis by bisulfite sequencing representing total (black) and sequence context-specific (mCG, red; mCHG, blue; mCHH, green) methylation. (D) Analysis of histone modifications and histone H3 abundance normalized to H3 or input at the HPT promoter by ChIP in C2S1 and mutant lines. Gray columns (right of the colored columns and very small) represent samples precipitated without antibodies.
Figure 4.
Figure 4.
Mutations in HOG1 and DDM1 Lead to a Global Decrease of DNA and Histone Methylation. (A) Global 5-mdC levels measured by HPLC are reduced in hog1-7 and ddm1-12 seedlings. (B) DNA gel blot analysis showing decreased DNA methylation at centromeric 180-bp repeats in hog1-7 and ddm1-12 mutant plants. (C) Chromocentric 5-mdC localization measured by immunofluorescence is lost only in ddm1-12 but not in hog1-7. DAPI, 4′,6-diamidino-2-phenylindole. (D) H3K9me2 compaction measured by immunofluorescence is disrupted in both mutants. The pie charts represent the percentage of nuclei with corresponding morphology. Gray, compact signals; white, dispersed signals.
Figure 5.
Figure 5.
The SAHH Inhibitor DHPA Interferes with Transcriptional Gene Silencing at LINE1-4. (A) Quantitative RT-PCR measuring the abundance of LINE1-4 mRNA after chromatin drug and SAHH inhibitor treatments. Error bars denote sd from triplicate analyses. (B) DNA gel blot analysis of DNA methylation with LINE1-4–specific probes after chromatin drug and SAHH inhibitor treatments. (C) ChIP analysis of H3K9me2 (red) and H3K4me3 (green) histone modifications after chromatin drug and SAHH inhibitor treatments. Gray columns denote samples precipitated without antibodies. [See online article for color version of this figure.]
Figure 6.
Figure 6.
The SAHH Inhibitor DHPA Interferes with Maintenance of paTGS at the HPT Transgene. (A) and (B) HPT transcript abundance in the inactive line C2S1 is significantly increased after treatments with DHPA. (C) Increasing levels of DHPA lead to hypomethylation of the P35S promoters at the silent HPT transgene. (D) The levels of H3K9 dimethylation (red) and H3K4 trimethlyation (green) at the P35S promoter changed after SAHH inhibitor treatments. Error bars in (A) and (D) denote sd from triplicate analyses. [See online article for color version of this figure.]
Figure 7.
Figure 7.
Cooperation of Multiple Chromatin Modifications to Generate Exceptional Stability of Silencing That Can Only Be Overcome by Simultaneous Removal of DNA Methylation (Black Lollipops) and Repressive Histone Modifications (Dimethylation at Lys-9 of histone H3). The chromatin remodeling enzyme DDM1 and the S-adenosyl homocysteine hydrolase HOG1/SAHH are required to maintain both modifications, and only their lack in ddm1 or hog1 mutant or reduction of the methyl group donor SAM upon inhibitor application (DHPA) can release the tight double lock. [See online article for color version of this figure.]

References

    1. Adams K.L., Wendel J.F. (2005). Polyploidy and genome evolution in plants. Curr. Opin. Plant Biol. 8: 135–141 - PubMed
    1. Baubec T. (2008). Maintenance of polyploidy-associated transcriptional gene silencing in Arabidopsis thaliana, dissertation (Austria: University of Vienna). http://othes.univie.ac.at/3756/
    1. Baubec T., Pecinka A., Rozhon W., Mittelsten Scheid O. (2009). Effective, homogeneous and transient interference with cytosine methylation in plant genomic DNA by zebularine. Plant J. 57: 542–554 - PMC - PubMed
    1. Bork P., Koonin E.V. (1993). An expanding family of helicases within the 'DEAD/H' superfamily. Nucleic Acids Res. 21: 751–752 - PMC - PubMed
    1. Brennecke J., Malone C.D., Aravin A.A., Sachidanandam R., Stark A., Hannon G.J. (2008). An epigenetic role for maternally inherited piRNAs in transposon silencing. Science 322: 1387–1392 - PMC - PubMed

Publication types

MeSH terms