

Quantitative site-specific phosphorylation dynamics of human protein kinases during mitotic progression
- PMID: 20097925
- PMCID: PMC2877978
- DOI: 10.1074/mcp.M900335-MCP200
Quantitative site-specific phosphorylation dynamics of human protein kinases during mitotic progression
Abstract
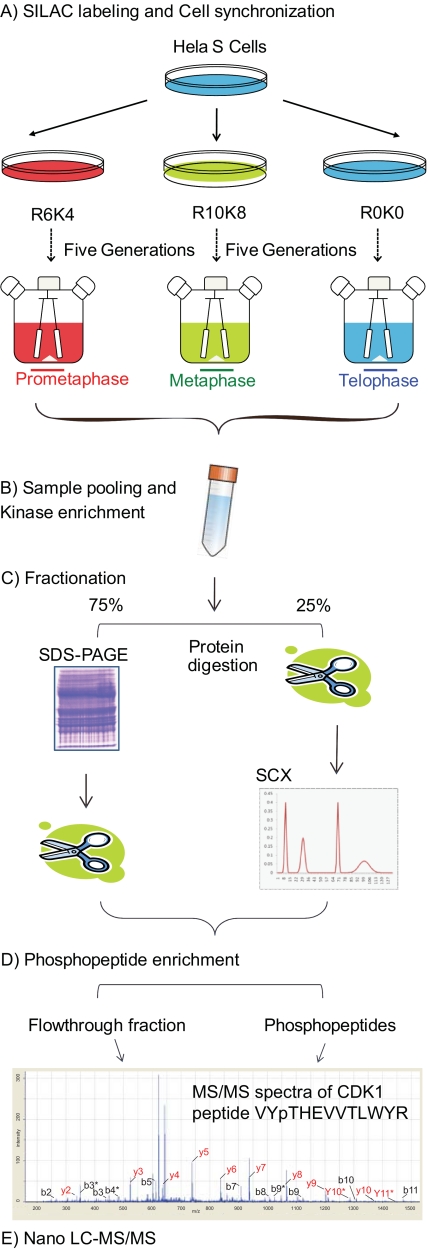
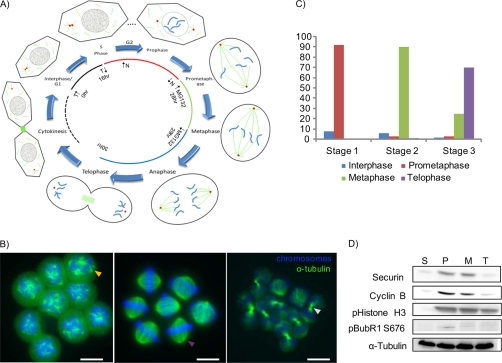
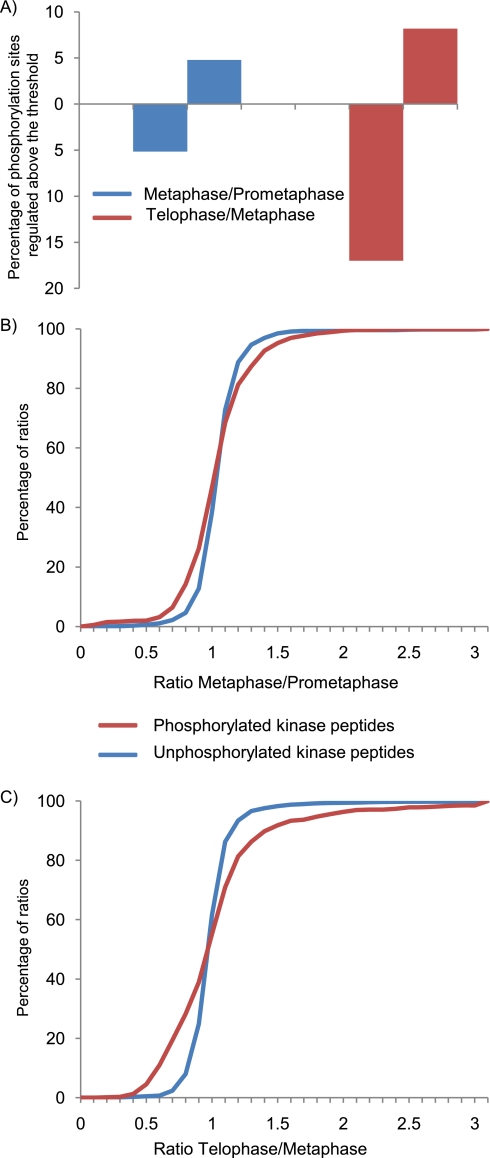
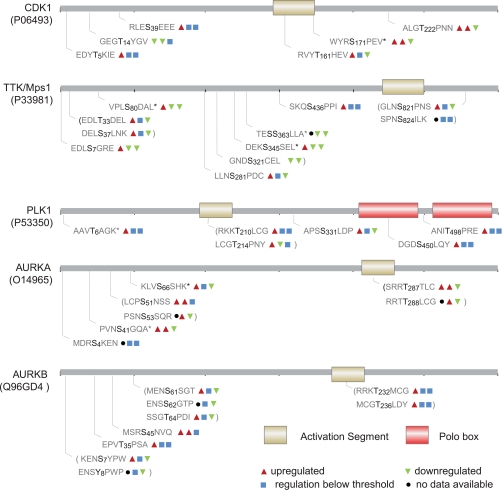
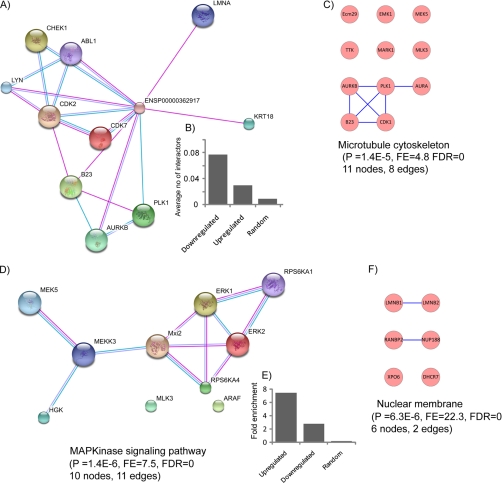
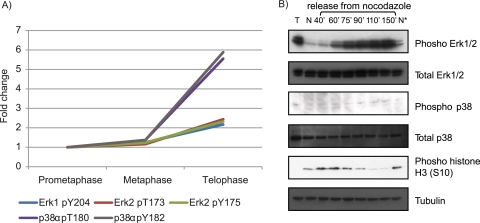
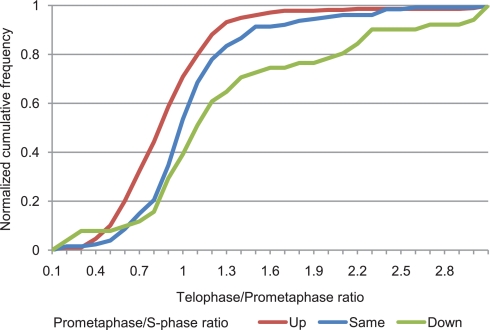
Reversible protein phosphorylation is a key regulatory mechanism of mitotic progression. Importantly, protein kinases themselves are also regulated by phosphorylation-dephosphorylation processes; hence, phosphorylation dynamics of kinases hold a wealth of information about phosphorylation networks. Here, we investigated the site-specific phosphorylation dynamics of human kinases during mitosis using synchronization of HeLa suspension cells, kinase enrichment, and high resolution mass spectrometry. In biological triplicate analyses, we identified 206 protein kinases and more than 900 protein kinase phosphorylation sites, including 61 phosphorylation sites on activation segments, and quantified their relative abundances across three specific mitotic stages. Around 25% of the kinase phosphorylation site ratios were found to be changed by at least 50% during mitotic progression. Further network analysis of jointly regulated kinase groups suggested that Cyclin-dependent kinase- and mitogen-activated kinase-centered interaction networks are coordinately down- and up-regulated in late mitosis, respectively. Importantly, our data cover most of the already known mitotic kinases and, moreover, identify attractive candidates for future studies of phosphorylation-based mitotic signaling. Thus, the results of this study provide a valuable resource for cell biologists and provide insight into the system properties of the mitotic phosphokinome.
Figures
Similar articles
-
Global Phosphoproteomic Mapping of Early Mitotic Exit in Human Cells Identifies Novel Substrate Dephosphorylation Motifs.Mol Cell Proteomics. 2015 Aug;14(8):2194-212. doi: 10.1074/mcp.M114.046938. Epub 2015 Jun 8. Mol Cell Proteomics. 2015. PMID: 26055452 Free PMC article.
-
Raptor is phosphorylated by cdc2 during mitosis.PLoS One. 2010 Feb 12;5(2):e9197. doi: 10.1371/journal.pone.0009197. PLoS One. 2010. PMID: 20169205 Free PMC article.
-
Quantitative analysis of the human spindle phosphoproteome at distinct mitotic stages.J Proteome Res. 2009 Oct;8(10):4553-63. doi: 10.1021/pr9003773. J Proteome Res. 2009. PMID: 19691289
-
The structural mechanisms that underpin mitotic kinase activation.Biochem Soc Trans. 2013 Aug;41(4):1037-41. doi: 10.1042/BST20130066. Biochem Soc Trans. 2013. PMID: 23863175 Review.
-
4D-networking by mitotic phosphatases.Curr Opin Cell Biol. 2013 Dec;25(6):697-703. doi: 10.1016/j.ceb.2013.06.005. Epub 2013 Jul 9. Curr Opin Cell Biol. 2013. PMID: 23849679 Review.
Cited by
-
A TPR domain-containing N-terminal module of MPS1 is required for its kinetochore localization by Aurora B.J Cell Biol. 2013 Apr 15;201(2):217-31. doi: 10.1083/jcb.201210033. Epub 2013 Apr 8. J Cell Biol. 2013. PMID: 23569217 Free PMC article.
-
Structure-function relationship of the Polo-like kinase in Trypanosoma brucei.J Cell Sci. 2012 Mar 15;125(Pt 6):1519-30. doi: 10.1242/jcs.094243. Epub 2012 Jan 24. J Cell Sci. 2012. PMID: 22275435 Free PMC article.
-
Cell cycle-dependent phosphorylation of Theileria annulata schizont surface proteins.PLoS One. 2014 Jul 31;9(7):e103821. doi: 10.1371/journal.pone.0103821. eCollection 2014. PLoS One. 2014. PMID: 25077614 Free PMC article.
-
Kinome analysis of receptor-induced phosphorylation in human natural killer cells.PLoS One. 2012;7(1):e29672. doi: 10.1371/journal.pone.0029672. Epub 2012 Jan 4. PLoS One. 2012. PMID: 22238634 Free PMC article.
-
Writing and Erasing O-GlcNAc on Casein Kinase 2 Alpha Alters the Phosphoproteome.ACS Chem Biol. 2022 May 20;17(5):1111-1121. doi: 10.1021/acschembio.1c00987. Epub 2022 Apr 25. ACS Chem Biol. 2022. PMID: 35467332 Free PMC article.
References
-
- Cohen P. (2002) The origins of protein phosphorylation. Nat. Cell Biol 4, E127–E130 - PubMed
-
- Pawson T., Scott J. D. (2005) Protein phosphorylation in signaling–50 years and counting. Trends Biochem. Sci 30, 286–290 - PubMed
-
- Graves J. D., Krebs E. G. (1999) Protein phosphorylation and signal transduction. Pharmacol. Ther 82, 111–121 - PubMed
-
- Manning G., Whyte D. B., Martinez R., Hunter T., Sudarsanam S. (2002) The protein kinase complement of the human genome. Science 298, 1912–1934 - PubMed
Publication types
MeSH terms
Substances
LinkOut - more resources
Full Text Sources
Molecular Biology Databases
