. 2010 Apr 2;285(14):10880-9.
doi: 10.1074/jbc.M109.081489. Epub 2010 Jan 24.

Sphingosine 1-phosphate lyase deficiency disrupts lipid homeostasis in liver

Affiliations

Sphingosine 1-phosphate lyase deficiency disrupts lipid homeostasis in liver

Meryem Bektas et al. J Biol Chem. .

Abstract

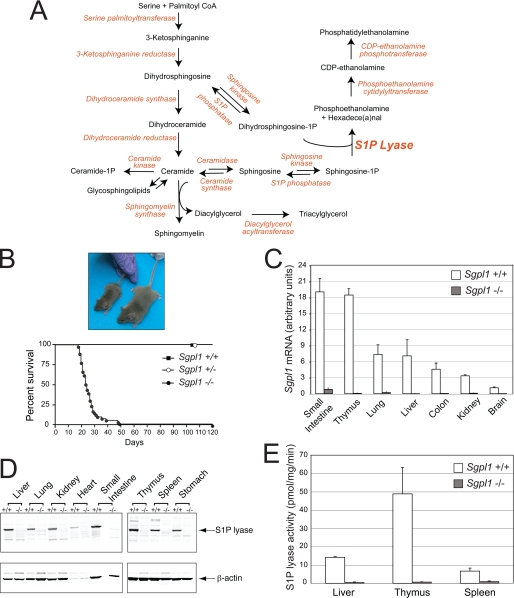
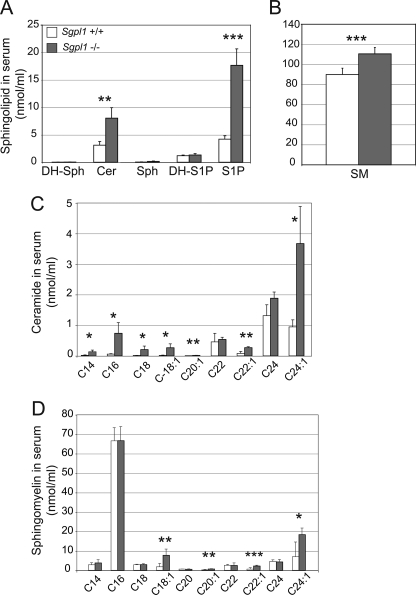
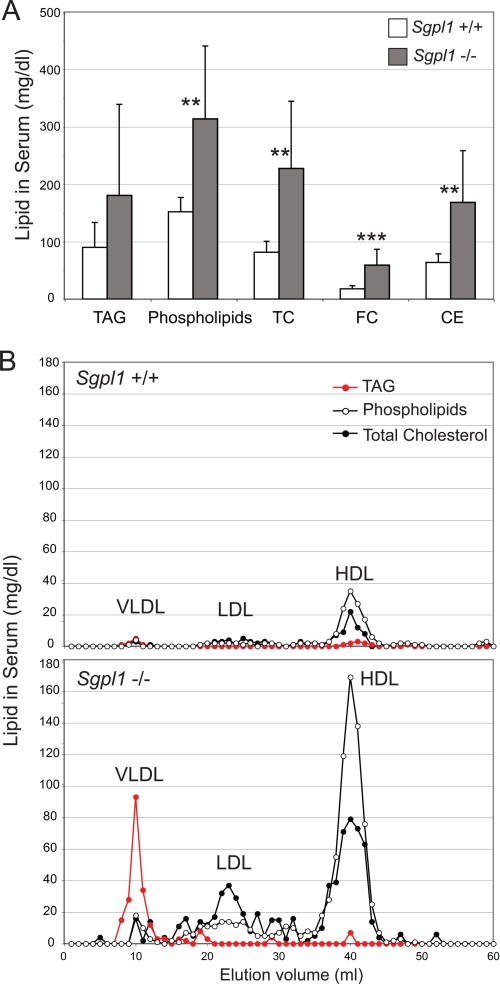
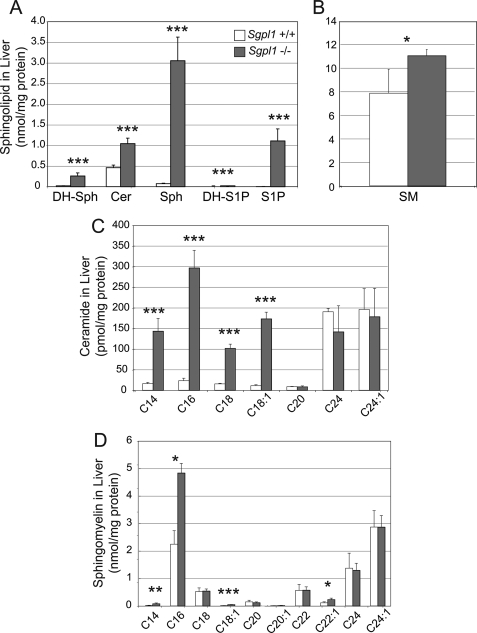
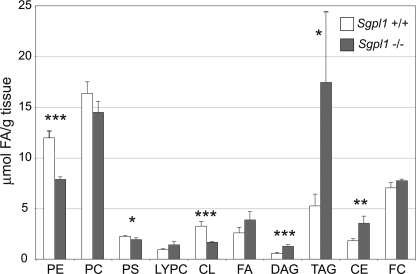
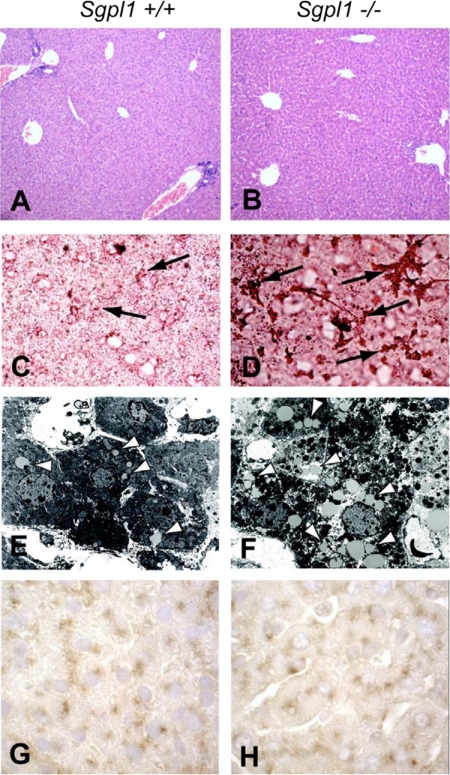
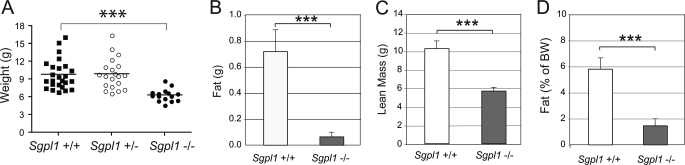
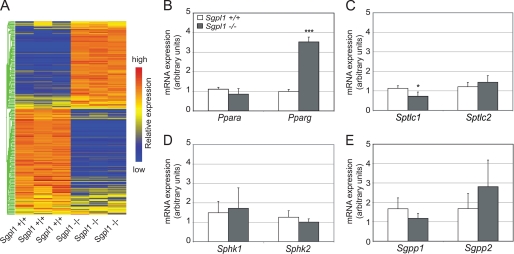
The cleavage of sphingoid base phosphates by sphingosine-1-phosphate (S1P) lyase to produce phosphoethanolamine and a fatty aldehyde is the final degradative step in the sphingolipid metabolic pathway. We have studied mice with an inactive S1P lyase gene and have found that, in addition to the expected increase of sphingoid base phosphates, other sphingolipids (including sphingosine, ceramide, and sphingomyelin) were substantially elevated in the serum and/or liver of these mice. This latter increase is consistent with a reutilization of the sphingosine backbone for sphingolipid synthesis due to its inability to exit the sphingolipid metabolic pathway. Furthermore, the S1P lyase deficiency resulted in changes in the levels of serum and liver lipids not directly within the sphingolipid pathway, including phospholipids, triacyglycerol, diacylglycerol, and cholesterol. Even though lipids in serum and lipid storage were elevated in liver, adiposity was reduced in the S1P lyase-deficient mice. Microarray analysis of lipid metabolism genes in liver showed that the S1P lyase deficiency caused widespread changes in their expression pattern, with a significant increase in the expression of PPARgamma, a master transcriptional regulator of lipid metabolism. However, the mRNA expression of the genes encoding the sphingosine kinases and S1P phosphatases, which directly control the levels of S1P, were not significantly changed in liver of the S1P lyase-deficient mice. These results demonstrate that S1P lyase is a key regulator of the levels of multiple sphingolipid substrates and reveal functional links between the sphingolipid metabolic pathway and other lipid metabolic pathways that may be mediated by shared lipid substrates and changes in gene expression programs. The disturbance of lipid homeostasis by altered sphingolipid levels may be relevant to metabolic diseases.


Figures

FIGURE 1.
FIGURE 1.
Gene trap disruption of the Sgpl1 gene causes S1P lyase deficiency. A, sphingolipid metabolic pathway and linkage to triacylglycerol and phosphatidylethanolamine synthesis. B, appearance and life span of Sgpl1−/−, Sgpl1+/−, and Sgpl1+/+ mice. C, RT-qPCR of Sgpl1 mRNA using RNA of various tissues from Sgpl1−/− (gray bars) and Sgpl1+/+ (open bars) mice. Gapdh was used as a reference gene for normalization. SI, small intestine. Data represent mean values ± S.E. D, top panel: Western blot of S1P lyase protein in various tissues from Sgpl1−/− and Sgpl1+/+ mice. Bottom panel, same blot probed with antibody to β-actin as a loading control. E, S1P lyase enzyme activity in extracts of various tissues from Sgpl1−/− (gray bars) and Sgpl1+/+ (open bars) mice. Data represent mean values ± S.E. of representative results from three independent experiments.
FIGURE 2.
FIGURE 2.
Sphingolipid levels are elevated in serum of Sgpl1−/− mice. Sphingolipid levels were determined in serum of Sgpl1−/− (gray bars) and Sgpl1+/+ (open bars) mice by LC-MS. A, total ceramide (Cer), sphingosine (Sph). B, total sphingomyelin (SM). C, individual ceramide fatty acid chain species. D, individual sphingomyelin fatty acid chain species. Data represent mean values ± S.E. n = 3. *, p < 0.05; **, p < 0.01; ***, p < 0.005, paired Student's t test.
FIGURE 3.
FIGURE 3.
Sgpl1−/− mice are hyperlipidemic. A, triacylglycerol (TAG), phospholipids, total cholesterol (TC), free cholesterol (FC), and cholesterol esters (CE) were determined in the serum of Sgpl1−/− (gray bars) and Sgpl1+/+ (open bars) mice. Data represent mean values ± S.E. n = 7. **, p < 0.01; ***, p < 0.005, paired Student's t test. B, pooled serum samples from Sgpl1−/− (closed circles) and Sgpl1+/+ (open circles) mice (n = 3 each genotype) were fractionated by FPLC to separate VLDL, LDL, and HDL.
FIGURE 4.
FIGURE 4.
Sphingolipids are elevated in the liver of Sgpl1−/− mice. Sphingolipid levels were determined in the liver of Sgpl1−/− (gray bars) and Sgpl1+/+ (open bars) mice by LC-MS. A, total ceramide (Cer), sphingosine (Sph). B, total sphingomyelin (SM). C, individual ceramide fatty acid chain species. D, individual sphingomyelin fatty acid chain species. Data represent mean values ± S.E. n = 3. *, p < 0.05; **, p < 0.01; ***, p < 0.005; paired Student's t test.
FIGURE 5.
FIGURE 5.
Lipid profile is altered in the liver of Sgpl1−/− mice. Lipid levels were determined in the liver of Sgpl1−/− (gray bars) and Sgpl1+/+ (open bars) mice as described under “Experimental Procedures.” PE, phosphatidylethanolamine; PC, phosphatidylcholine; PS, phosphatidylserine; LYPC, lysophosphatidylcholine; CL, cardiolipin; FA, fatty acids; DAG, diacylglycerol; TAG, triacylglycerol; CE, cholesterol esters; FC, free cholesterol. Data represent mean values ± S.E. n = 3. *, p < 0.05; **, p < 0.01; ***, p < 0.005; paired Student's t test.
FIGURE 6.
FIGURE 6.
Excess lipids are stored in the liver of Sgpl1−/− mice. Paraffin-embedded liver sections from (A) Sgpl1+/+ or (B) Sgpl1−/− mice were stained with H&E (×10 magnification). Frozen sections of liver from (C) Sgpl1+/+ or (D) Sgpl1−/− mice were stained with Oil red O (×40 magnification). Arrows indicate lipid deposits. Liver samples from (E) Sgpl1+/+ or (F) Sgpl1−/− mice were analyzed by electron microscopy (×6000 magnification). Arrowheads indicate examples of lipid droplets. Liver sections from (G) Sgpl1+/+ or (H) Sgpl1−/− mice immunostained with LAMP-2 antibody (brown reaction product) and counterstained with hematoxylin (×100 magnification).
FIGURE 7.
FIGURE 7.
Adiposity is reduced in Sgpl1−/− mice. A, weights of the mice were taken at about 18 days after birth. ***, p < 0.005. Sgpl1−/− (gray bars) and Sgpl1+/+ (open bars) mice were subjected to quantitative magnetic resonance body composition analysis to determine their fat (B) and lean mass (C) content. The fat mass as a percent of body weight is presented in (D). Data represent mean values ± S.E. n = 3. ***, p < 0.005, paired Student's t test.
FIGURE 8.
FIGURE 8.
Lipid metabolism gene expression profile in the liver of Sgpl1−/− mice exhibits widespread alteration. A, Affymetrix microarray gene expression analysis was performed with liver RNA from three Sgpl1+/+ and three Sgpl1−/− mice. The raw signal values of the genes from the GO category lipid metabolic process were clustered to produce a heat map as described under “Experimental Procedures.” Blue corresponds to reduced expression relative to red, which corresponds to relatively increased expression. RT-qPCR analysis of (B) Ppara and Pparg, (C) Sptlc1, and Sptlc2, (D) Sphk1 and Sphk2, and (E) Sgpp1 and Sgpp2 in liver mRNA from Sgpl1−/− (gray bars) and Sgpl1+/+ (open bars) mice. Data represent mean values ± S.E. n = 3. *, p < 0.05; ***, p < 0.005, paired Student's t test.

Similar articles

Cited by

References

    1. Futerman A. H., Hannun Y. A. (2004) EMBO Rep. 5, 777–782 - PMC - PubMed
    1. Merrill A. H., Jr. (2002) J. Biol. Chem. 277, 25843–25846 - PubMed
    1. Fyrst H., Saba J. D. (2008) Biochim. Biophys. Acta 1781, 448–458 - PMC - PubMed
    1. Saba J. D., Nara F., Bielawska A., Garrett S., Hannun Y. A. (1997) J. Biol. Chem. 272, 26087–26090 - PubMed
    1. Le Stunff H., Giussani P., Maceyka M., Lépine S., Milstien S., Spiegel S. (2007) J. Biol. Chem. 282, 34372–34380 - PubMed

Publication types

MeSH terms