. 2010 Mar;13(3):379-85.
doi: 10.1038/nn.2485. Epub 2010 Jan 24.

Perceptual decision making in less than 30 milliseconds

Affiliations

Perceptual decision making in less than 30 milliseconds

Terrence R Stanford et al. Nat Neurosci. 2010 Mar.

Abstract

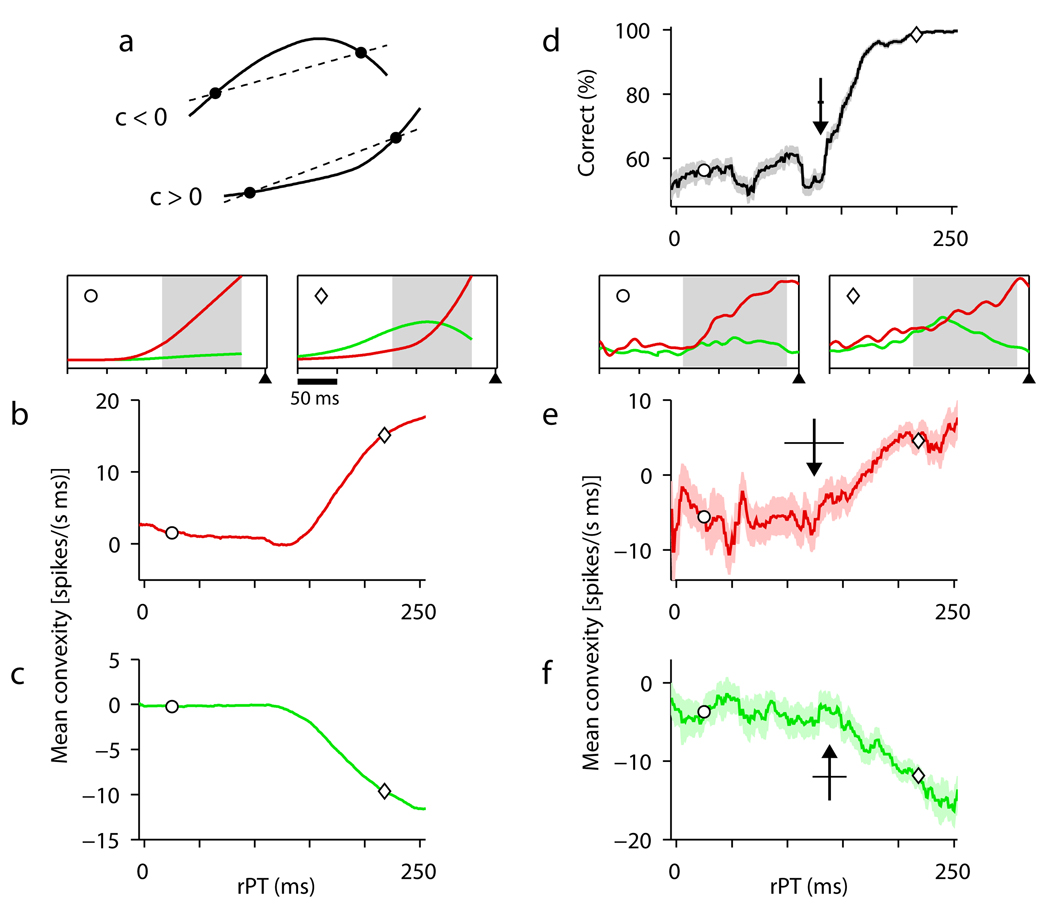
In perceptual discrimination tasks, a subject's response time is determined by both sensory and motor processes. Measuring the time consumed by the perceptual evaluation step alone is therefore complicated by factors such as motor preparation, task difficulty and speed-accuracy tradeoffs. Here we present a task design that minimizes these confounding factors and allows us to track a subject's perceptual performance with unprecedented temporal resolution. We find that monkeys can make accurate color discriminations in less than 30 ms. Furthermore, our simple task design provides a tool for elucidating how neuronal activity relates to sensory as opposed to motor processing, as demonstrated with neural data from cortical oculomotor neurons. In these cells, perceptual information acts by accelerating and decelerating the ongoing motor plans associated with correct and incorrect choices, as predicted by a race-to-threshold model, and the time course of these neural events parallels the time course of the subject's choice accuracy.


Figures

Figure 1
Figure 1
Sequence of events in the CS task. A trial is correct if the subject makes an eye movement to the peripheral location that matches the color of the fixation spot (red in this example). The subject must initiate a response (left or right) when the fixation spot disappears (Go), although target and distracter are revealed gap ms later (Cue).
Figure 2
Figure 2
Oculomotor execution during the CS task. a, b, Eye velocity (a) and eye position (b) as functions of time for 30 saccades performed by monkey S in short-gap (50–100 ms) trials. Only horizontal components are shown. Black lines are single-trial traces; gray lines are averages. Numbers shown are mean peak velocity and mean width at half-height ± s.e.m. c, d, Eye velocity (c) and eye position (d) as functions of time for 30 saccades performed by monkey S in long-gap (200–250 ms) trials. eh, As in ad, but for 30 short-gap (e, f) and 30 long-gap (g, h) trials performed by monkey G.
Figure 3
Figure 3
Behavioral and model performance in the CS task. a, Percentage of correct responses as a function of time gap (psychometric curve). Numbers of trials per point are 568 ≤ n ≤ 598 for monkey S and 702 ≤ n ≤ 777 for monkey G. b, Mean RT ± 1 s.d. as a function of gap (chronometric curve). Each point includes both correct and incorrect trials. c, Distributions of ePT values for correct (black and blue bars) and incorrect (magenta lines) trials. d, Percentage of correct responses as a function of ePT (tachometric curve). e, Distributions of RT values at five gaps. Gap values are indicated on upper left corners. RTs for correct (black and blue bars) and incorrect trials (magenta lines) are shown. In c and d, bin width is 20 ms; in e it is 40 ms. All results labeled “Model” are from simulated trials generated with identical parameter values for each monkey.
Figure 4
Figure 4
Five trials of the race-to-threshold model. Each plot shows the decision variables xL (green) and xR (red) as functions of time. Black triangles and vertical lines mark when the go signal is given (Go) and when the saccade is initiated (Sac); the interval between them is the RT. In these examples xL and xR start racing 60 ms (afferent delay) after the go signal and a saccade is produced 30 ms (efferent delay) after the threshold (dotted line) is crossed. Initially, build-up rates are drawn randomly and remain constant during the gap period (gray shade), but once the cue information becomes available (end of gray shade), the build-up rate for the target side (xR in these examples) starts increasing and that for the distracter side starts decreasing. ac, Three trials with a 100 ms gap. d, e, Two trials with a 250 ms gap. In all examples the target was red and was located on the right, so a, b, d are correct and c, e are incorrect trials. Horizontal bars at the bottom indicate the ePT period in each trial; ePT values are positive (black) for races that are influenced by the sensory information (ac) and negative (dark gray) for races that end before the cue information becomes available (d, e).
Figure 5
Figure 5
Behavioral and model performance in the motor-bias experiment. Trials are sorted according to choices, either toward the high-reward side (black) or the low-reward side (orange). a, Fractions of saccades made to the high- and low-reward sides as functions of gap (330 ≤ n ≤ 361 trials per gap). b, Percentages of correct choices as functions of gap. c, Mean RTs ± 1 s.d. as functions of gap. d, Distributions of ePT values for correct (black bars) and incorrect responses (gray lines) toward the high-reward side. e, Distributions of ePT values for correct (orange bars) and incorrect responses (gray lines) toward the low-reward side. f, Percentages of correct responses as functions of ePT for high- (black lines) and low-reward (orange lines) trials. g, For each ePT, the curves show the fraction of all saccades (orange lines) or of all correct saccades (gray lines) made to the low-reward side. ePT bin size is 20 ms.
Figure 6
Figure 6
Oculomotor activity during the CS task. a, Tachometric curve obtained from all recording sessions; n = 7,282 trials. Note the x axis is rPT (= RT − gap). Shaded areas indicate short- and long-rPT groups. b, Mean time courses of the decision variables xL and xR synchronized on threshold crossing (dashed line), with saccades assumed to occur 30 ms later (triangles and vertical lines). Correct model responses into (red) and away (green) from the MF are shown for short (left side) and long (right side) rPTs. c, Responses of a single FEF neuron during correct trials into the MF, for short (left side) and long (right side) rPTs. Each panel shows spike trains from 30 trials synchronized on saccade onset (triangles and vertical lines). Firing rates as functions of time (red traces) were obtained by convolving the spikes with a Gaussian of σ = 6 ms. The key on the right indicates MF (gray patch), target (filled circle), and distracter (open circle) positions. d, Responses from the same cell as in c, but for correct saccades away from the MF. e, Average firing rates as functions of time obtained from 30 FEF neurons. For each cell, activity was normalized by the firing rate at saccade onset in short-rPT trials into the MF. Light colors indicate ± 1 s.e.m. Note differences between short- (left side) and long-rPT (right side) responses.
Figure 7
Figure 7
Sensory information accelerates oculomotor activity. a, The mean convexity c between two points on a curve is computed as the average difference between the line that joins those points (dotted line) and the curve values (continuous traces). b,c, Mean convexity of the trajectories of the model variables xL and xR as a function of rPT. Red and green lines indicate correct trials into and away from the MF, respectively. Insets above b show mean trajectories obtained in two rPT bins (keyed by a circle and a diamond). Shaded areas indicate the interval used to calculate convexity. d, Tachometric curve from all recording sessions. Arrow indicates the transition point at which the curve starts increasing. Horizontal line across arrow indicates error s.d. (from jackknife; see Methods). e, f, Mean convexity of the FEF population activity as a function of rPT, for correct trials into (red) and away (green) from the MF. Light colors indicate ± 1 s.e.m. Arrows indicate transition points and horizontal lines are error s.d. (from jackknife). Before averaging across cells, rates were normalized as in Figure 6e. Other conventions as in b, c. rPT bin size is 40 ms.

Comment in

Similar articles

Cited by

References

    1. Britten KH, Shadlen MN, Newsome WT, Movshon JA. The analysis of visual motion: a comparison of neuronal and psychophysial performance. J. Neurosci. 1992;12:4745–4765. - PMC - PubMed
    1. Dodd JV, Krug K, Cumming BG, Parker AJ. Perceptually bistable three-dimensional figures evoke high choice probabilities in cortical area MT. J. Neurosci. 2001;21:4809–4821. - PMC - PubMed
    1. Ernst MO, Banks MS. Humans integrate visual and haptic information in a statistically optimal fashion. Nature. 2002;415:429–433. - PubMed
    1. Sugrue LP, Corrado GS, Newsome WT. Matching behavior and the representation of value in the parietal cortex. Science. 2004;304:1782–1787. - PubMed
    1. de Lafuente V, Romo R. Neuronal correlates of subjective sensory experience. Nature Neurosci. 2005;8:1698–1703. - PubMed

Publication types