Comparative Study
. 2010 Feb;17(2):187-93.
doi: 10.1038/nsmb.1720. Epub 2010 Jan 24.

Aberrant alternative splicing and extracellular matrix gene expression in mouse models of myotonic dystrophy

Affiliations
Comparative Study

Aberrant alternative splicing and extracellular matrix gene expression in mouse models of myotonic dystrophy

Hongqing Du et al. Nat Struct Mol Biol. 2010 Feb.

Abstract

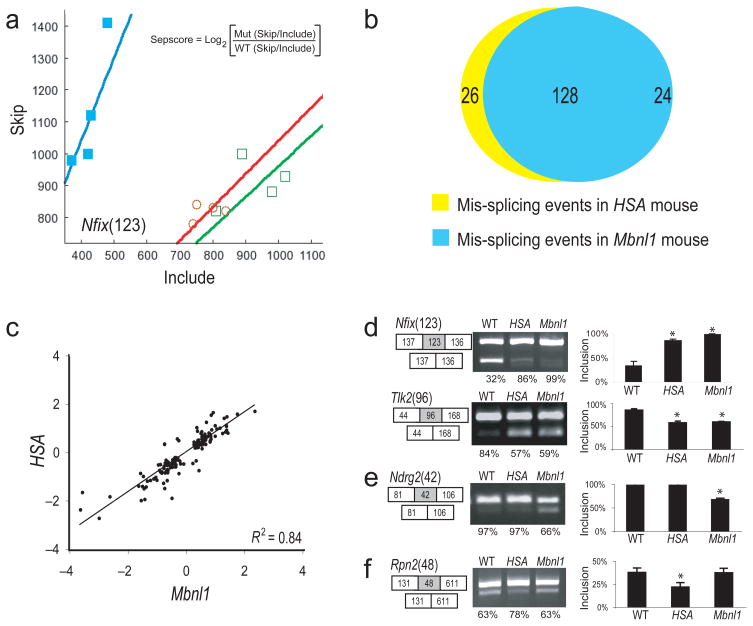
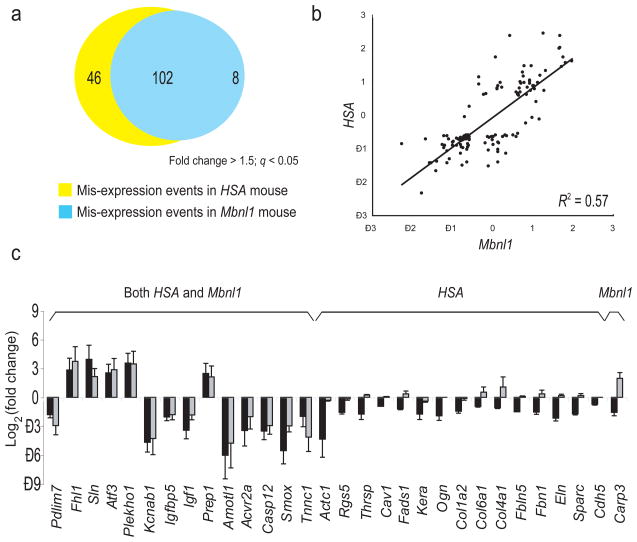
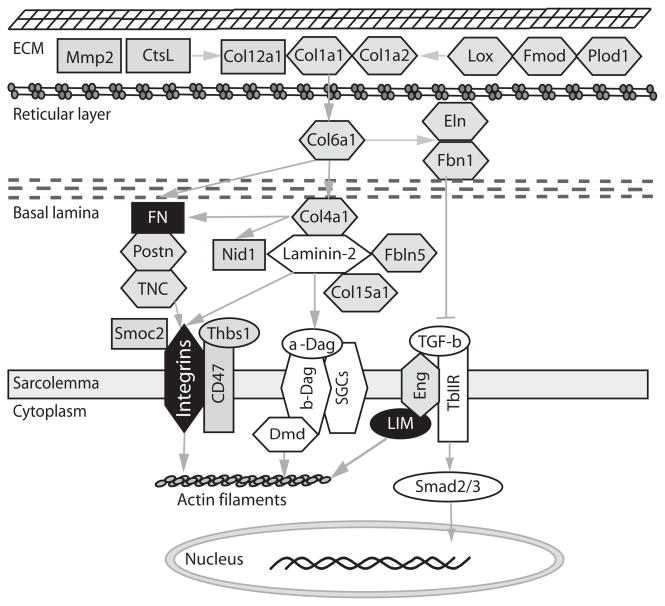
The common form of myotonic dystrophy (DM1) is associated with the expression of expanded CTG DNA repeats as RNA (CUG(exp) RNA). To test whether CUG(exp) RNA creates a global splicing defect, we compared the skeletal muscle of two mouse models of DM1, one expressing a CTG(exp) transgene and another homozygous for a defective muscleblind 1 (Mbnl1) gene. Strong correlation in splicing changes for approximately 100 new Mbnl1-regulated exons indicates that loss of Mbnl1 explains >80% of the splicing pathology due to CUG(exp) RNA. In contrast, only about half of mRNA-level changes can be attributed to loss of Mbnl1, indicating that CUG(exp) RNA has Mbnl1-independent effects, particularly on mRNAs for extracellular matrix proteins. We propose that CUG(exp) RNA causes two separate effects: loss of Mbnl1 function (disrupting splicing) and loss of another function that disrupts extracellular matrix mRNA regulation, possibly mediated by Mbnl2. These findings reveal unanticipated similarities between DM1 and other muscular dystrophies.


Figures

Figure 1
Figure 1
Comparison of splicing perturbation in the two mouse models. (a) Plot of skip/include ratio array data for an exon from Nfix in wt (filled squares), HSALR (open circles) and Mbnl1ΔE3/ΔE3 (open squares) mice (n = 4). Separation score is the log2 ratio of skipping probe set intensity versus include probe set intensity in a mutant relative to wild-type (see inset, also see Methods). (b) Diagram showing numbers of aberrant splicing events in HSALR mice and Mbnl1ΔE3/ΔE3 mice with |sepscore| ≥ 0.3. (c) Correlation of sepscore values for aberrant splicing in HSALR compared to Mbnl1ΔE3/ΔE3 mice (Pearson R2 = 0.84). (d–f) Validation of members from different classes of events by RT-PCR. (d) Exons either up (Nfix) or down (Tlk) regulated in both HSALR and Mbnl1ΔE3/ΔE3 mice, (e) an exon only affected in Mbnl1ΔE3/ΔE3 mice, or (f) only affected in HSALR mice. The numbers in parentheses represent the length in nt of the affected exon (gray box), shown with flanking exons (white boxes). The RT-PCR products from three individual mice were quantified using the Bioanalyzer, and inclusion rates were calculated. Samples were judged as different from wild type if a t-test indicated that the sample was unlikely to be from the wild type distribution with p < 0.05 (asterisks).
Figure 2
Figure 2
RNA motifs found by bioinformatics analysis near exons altered in the mouse models. (a–b) Improbizer identifies a motif containing CUGCY upstream of Mbnl1-repressed exons (a) and downstream of Mbnl1-activated exons (b). (c–d) Mapping CUGCY elements upstream (c) and downstream (d) of the Mbnl1-repressed and Mbnl1-activated exons. Each point represents the average frequency of CUGCY element for the 55 Mbnl1-repressed exons (blue triangles), or 66 Mbnl1-activated exons (red squares) or 790 expressed alternative cassette exons that did not change in the experiment (grey circles). Error bars indicate plus and minus two standard deviations of the mean frequency distribution for this population of background exons.
Figure 3
Figure 3
YGCY motifs mediate Mbnl1-dependent splicing repression and activation. Intron (lower case) and exon sequences (upper case and boxed) for the (a) Vldlr(84) and (b) Nfix(123) exons are shown, and mutations that disrupt YGCY motifs are labeled with arrows. Mouse embryo fibroblasts lacking endogenous Mbnl1 (derived from the Mbnl1ΔE3/ΔE3 mouse) were transfected with the splicing reporter and either no expression plasmid (−) or a plasmid producing Mbnl1-GFP protein (MBNL1) or just GFP protein (GFP) and exon inclusion was measured by RT-PCR using the bioanalyzer. Significant splicing changes (t-test derived p < 0.05) are labeled with an asterisk.
Figure 4
Figure 4
Test of human DM1 patients for splicing perturbations newly predicted from mouse model microarray data. Skeletal muscle RNA from 3 individual DM1 patients and one normal human control were compared to those from HSALR and Mbnl1ΔE3/ΔE3 mice by RT-PCR. Inclusion rates were determined on a Bioanalyzer. Statistically significant differences from the normal individual human are indicated by an asterisk, however this captures only technical variation in the RT-PCR protocol, as a single original RNA donation was processed in triplicate. For mouse samples, three individuals of each genetic type were compared, so that statistical differences here arise from both biological and technical variation. Note that extent of genetic variation between the humans is unknown (except at the CTGexp locus), but is likely much greater than the differences between the mouse groups.
Figure 5
Figure 5
Comparison of altered mRNA levels in the two mouse models. (a) Numbers of genes with altered mRNA levels in HSALR and Mbnl1ΔE3/ΔE3 mice (cutoff: Fold change ≥ 1.5; q ≤ 0.05). (b) Comparison of magnitudes of the log2(fold change) in mRNA levels in the two mouse models (Spearman R2 = 0.57). (c) Validation of altered mRNA levels found on arrays by quantitative RT-PCR. Quantification of triplicate data with error bars (± SD) is shown, where black bars represent change in HSALR mice, and grey bars represent change in Mbnl1ΔE3/ΔE3 mice.
Figure 6
Figure 6
ECM proteins whose mRNA levels are altered by CUGexp RNA expression. The proteins whose mRNAs are misregulated in HSALR but not Mbnl1ΔE3/ΔE3 mice (class II genes) are shown in grey, and other proteins in the same network are shown in white. Proteins in black are those whose mRNAs have splicing perturbations in both HSALR and Mbnl1ΔE3/ΔE3 mice. Proteins in hexagons are known to be associated with other muscular dystrophies or connective tissue diseases (see text), and grey arrows denote regulatory interactions.

Comment in

Similar articles

Cited by

References

    1. Mirkin SM. Expandable DNA repeats and human disease. Nature. 2007;447:932–40. - PubMed
    1. Caskey CT, Pizzuti A, Fu YH, Fenwick RG, Jr, Nelson DL. Triplet repeat mutations in human disease. Science. 1992;256:784–9. - PubMed
    1. Buxton J, et al. Detection of an unstable fragment of DNA specific to individuals with myotonic dystrophy. Nature. 1992;355:547–8. - PubMed
    1. Taneja KL, McCurrach M, Schalling M, Housman D, Singer RH. Foci of trinucleotide repeat transcripts in nuclei of myotonic dystrophy cells and tissues. J Cell Biol. 1995;128:995–1002. - PMC - PubMed
    1. Mankodi A, Lin X, Blaxall BC, Swanson MS, Thornton CA. Nuclear RNA foci in the heart in myotonic dystrophy. Circ Res. 2005;97:1152–5. - PubMed

Publication types

Associated data