. 2010 Mar;11(3):216-24.
doi: 10.1038/ni.1838. Epub 2010 Jan 24.

Temporal changes in dendritic cell subsets, cross-priming and costimulation via CD70 control CD8(+) T cell responses to influenza

Affiliations

Temporal changes in dendritic cell subsets, cross-priming and costimulation via CD70 control CD8(+) T cell responses to influenza

André Ballesteros-Tato et al. Nat Immunol. 2010 Mar.

Erratum in

  • Nat Immunol. 2010 Jul;11(7):644

Abstract

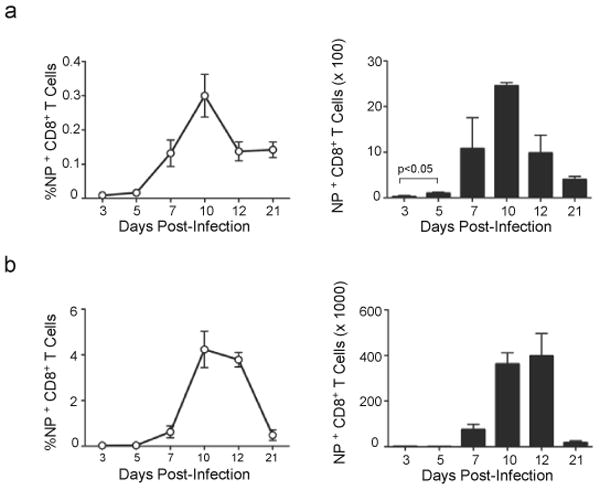
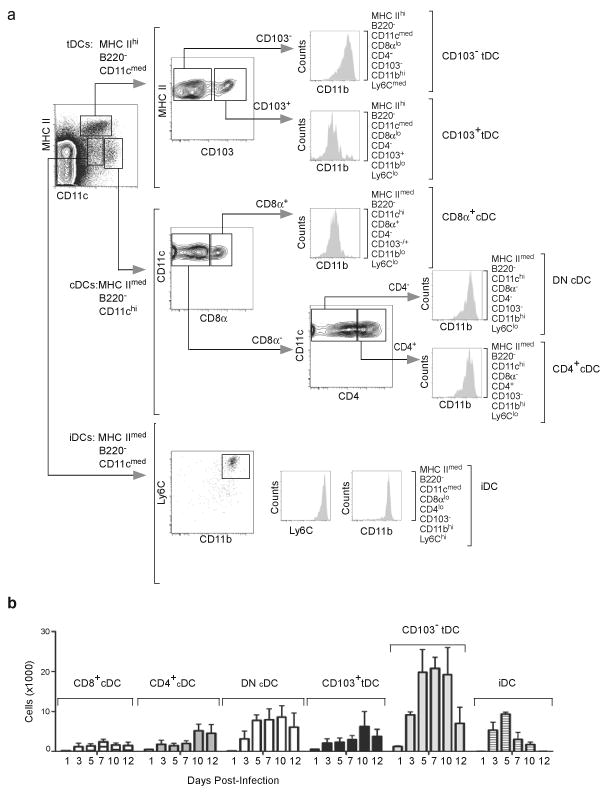
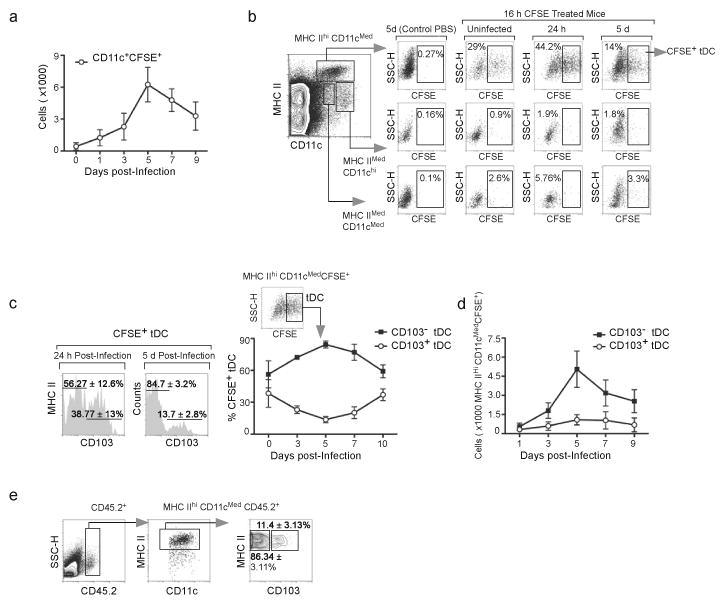
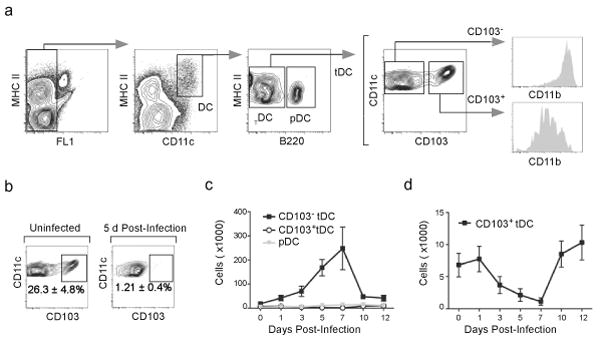
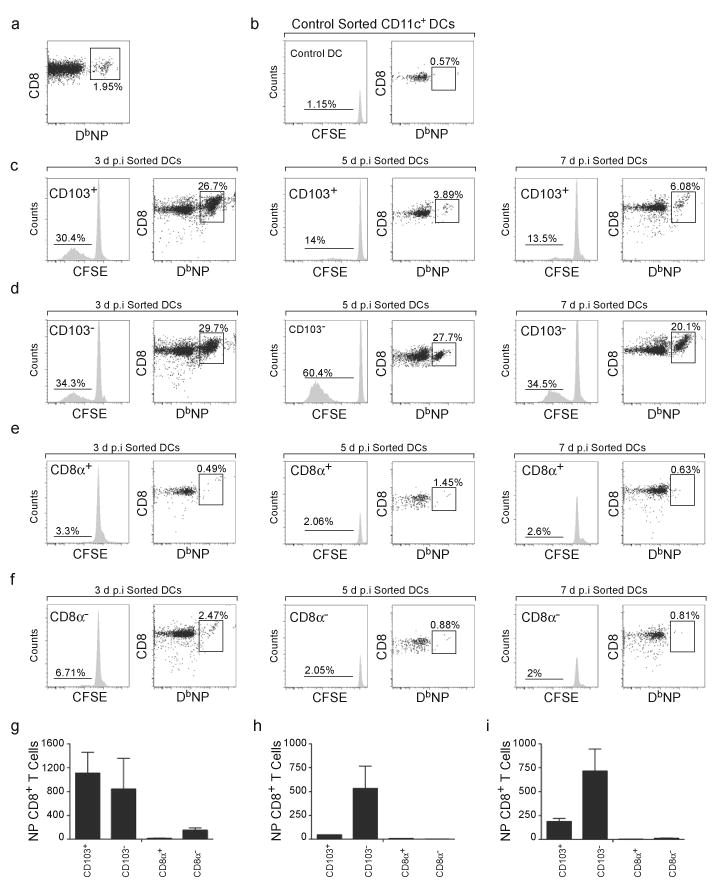
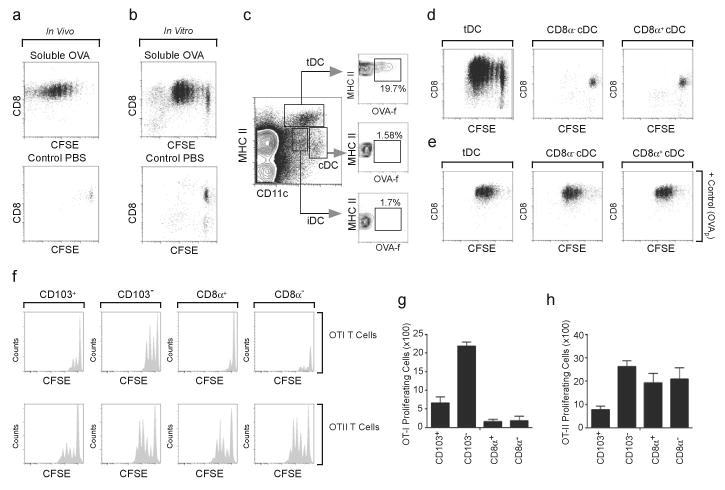
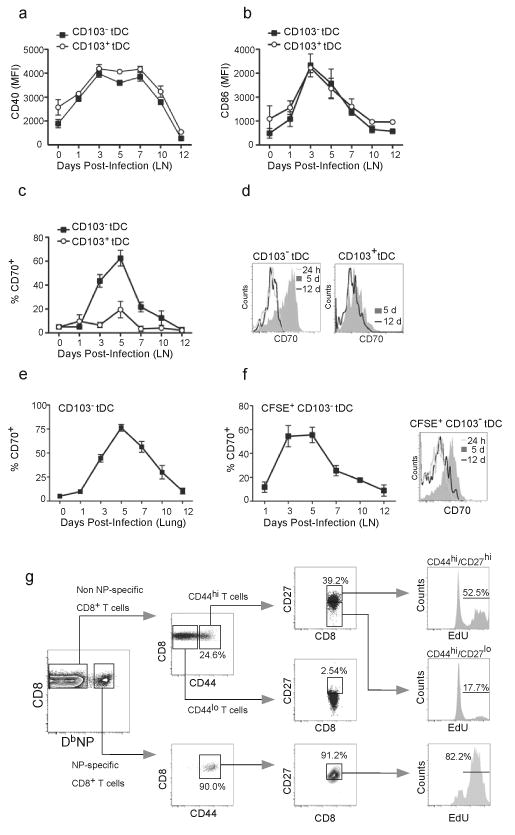
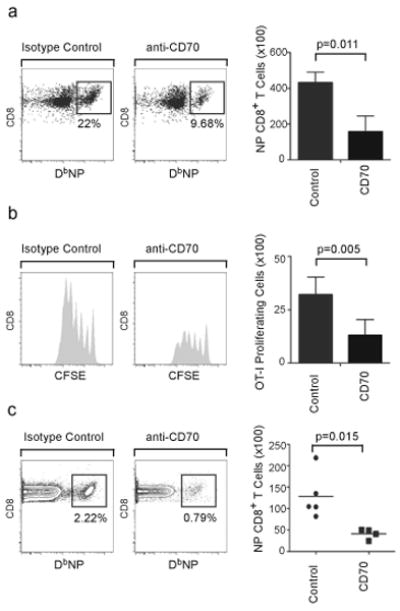
The question of which dendritic cells (DCs) respond to pulmonary antigens and cross-prime CD8(+) T cells remains controversial. We show here that influenza-specific CD8(+) T cell priming was controlled by different DCs at different times after infection. Whereas early priming was controlled by both CD103(+)CD11b(lo) and CD103(-)CD11b(hi) DCs, CD103(-)CD11b(hi) DCs dominated antigen presentation at the peak of infection. Moreover, CD103(-)CD11b(hi) DCs captured exogenous antigens in the lungs and directly cross-primed CD8(+) T cells in the draining lymph nodes without transferring antigen to CD8alpha(+) DCs. Finally, we show that CD103(-)CD11b(hi) DCs were the only DCs to express CD70 after influenza infection and that CD70 expression on CD103(-)CD11b(hi) DCs licensed them to expand CD8(+) T cell populations responding to both influenza and exogenous ovalbumin.


Figures

Figure 1
Figure 1. The NP-specific CD8+ T cell in the mLN precedes that in the lung
(a,b) C57BL/6 mice were infected intranasally with PR8. Frequencies of NP-specific CD8+ T cells in mLNs (a) and lungs (b) were determined by flow cytometry (left) and the total numbers (right) were calculated at the indicated times. Data are shown as the mean ± SD (n = 5 mice/point). Data are representative of three independent experiments.
Figure 2
Figure 2. DC subsets in mLN after influenza infection
(a) Mice were infected intranasally with PR8 and DC subsets were analyzed by flow cytometry on day 7 after infection. Plasmacytoid DCs were initially excluded based on B220 expression and the three major subsets that remained were defined as conventional DCs (cDCs: MHCIImedCD11chi), tissue DCs (tDCs: MHCIIhiCD11cmed) and inflammatory DCs (iDCs: MHCIImedCD11cmedLy6chi). Each of these populations was further characterized based on the expression of CD8α, CD4, CD103, CD11b and Ly6C. (b) C57BL/6 mice were infected intranasally with PR8 and CD8α+ cDCs, CD4+CD8αcDCs, CD8CD4cDCs, CD103+CD11blo tDCs, CD103CD11bhi tDCs and iDCs were enumerated by flow cytometry as described in a. Values represent the total numbers (mean ± SD) of each subset calculated at each time point (n = 4–5 mice / time point). Data are representative of three independent experiments.
Figure 3
Figure 3. Influenza infection triggers recruitment of CD103CD11bhi tDCs to the mLN
(a) C57BL/6 mice were infected with PR8 and 16 h prior to sacrifice, cells in the lung were labeled with CFSE by intranasal instillation. CFSE-labeled CD11c+ cells in the mLNs were enumerated by flow cytometry at the indicated times. Values represent the number (mean ± SD) of CFSE-labeled CD11c+ cells calculated for each time point (n = 4–5 mice/time point). Data are representative of three independent experiments. (b) Influenza-infected mice were treated with CFSE or PBS as indicated in a and the phenotypes of CFSE-labeled DCs were determined by flow cytometry at the indicated times. Percentage of CFSE-labeled cells within tDC, cDC and iDC subsets are shown. (c,d) Influenza-infected mice were treated with CFSE as indicated in a and the frequencies (c) and the total numbers (d) of CFSE-labeled CD103+CD11blo and CD103CD11bhi tDCs were determined by flow cytometry. Data are shown as the mean ± SD (n = 4–5 mice/time point). Data are representative of three independent experiments. (e) C57BL/6 donor mice (CD45.2) and CD45.1 recipient mice were infected intranasally with PR8. CD11c+ cells were isolated from donors lungs 5 days after infection and intranasally transferred to recipients (also 5 days after infection). Frequencies of CD103+CD11blo and CD103CD11bhi cells with the donor marker (CD45.2) in the mLNs were determined 24 h later by flow cytometry. Results are representative of five experiments.
Figure 4
Figure 4. CD103CD11bhi tDCs accumulate in the lung after influenza infection
(a) C57BL/6 mice were infected with PR8 and DC subsets in the lung were analyzed by flow cytometry on day 12 after infection. Autofluorescent cells were excluded from the analysis and DCs were subsequently defined as autoloMCHII+CD11c+. pDCs were excluded based on B220 expression and the remaining DCs were divided based on the expression of CD103 and CD11b. (b) C57BL/6 mice were infected intranasally with PR8 or left uninfected and the frequencies of CD103+CD11blo and CD103CD11bhi tDCs were determined by flow cytometry 5 days later. Percentages indicate the frequency of CD103+ cells within the total DC population. (c) C57BL/6 mice were infected intranasally with PR8 and the frequencies of pDCs as well as CD103+CD11blo and CD103CD11bhi tDCs were determined by flow cytometry at the indicated times. Values represent the total number (mean ± SD) of DCs in each subset calculated for each time point (n = 4–5 mice/time point). Data are representative of three independent experiments. (d) Data for CD103+CD11blo DCs from panel c with expanded scale.
Figure 5
Figure 5. CD103CD11bhi tDCs continue to present antigen at late times after infection
(a) C57BL/6 mice were infected with PR8 and CD8+ T cells were purified from draining mLNs 7 days later. The frequency of NP-specific CD8+ T cells in the purified population was evaluated by flow cytometry. (b) Purified CD8+ T cells from panel a were labeled with CFSE and co-cultured with CD11c+ DCs from the spleens of uninfected mice. The frequency of NP-specific CD8+ T cells that had divided (histogram) and frequency of NP-specific CD8+ T cells in the total CD8+ T cell population (dot plot) were evaluated by flow cytometry after 3 days of culture.(cf) Purified CD8+ T cells from panel a were labeled with CFSE and co-cultured with CD103+CD11blo tDCs (c), CD103CD11bhi tDCs (d), CD8α+ cDCs (e) and CD8αcDCs (f) that were sorted from the mLNs of mice that had been infected with PR8 3, 5 or 7 days previously. The frequency of NP-specific CD8+ T cells that had divided (histogram) and frequency of NP-specific CD8+ T cells in the total CD8+ T cell population (dot plot) were evaluated by flow cytometry after 3 days of culture. (gi) The number (mean ± SD) of proliferating CFSElo NP-specific CD8+ T cells was calculated for cultures initiated with day 3 DCs (g), day 5 DCs (h) and day 7 DCs (i). All values were obtained in triplicate. The results in panels a-i are representative of three independent experiments.
Figure 6
Figure 6. CD103CD11bhi tDCs cross-present soluble antigens captured in the lung
(a) CFSE-labeled OT-I cells (CD45.2) were adoptively transferred into CD45.1 mice 4 days after PR8 infection and recipient mice were treated intranasally with PBS or 60 μg of FITC-OVA 24 h later. Proliferation of transferred OT-I cells in the mLN was assessed 72 h later by flow cytometry. Plots shown are gated on CD45.2. Results are representative of five experiments. (b) C57BL/6 mice were infected with PR8 and treated intranasally with PBS or 60 μg of soluble FITC-OVA 5 days later. CD11c+ cells were purified from mLNs 16 h after OVA administration and were co-cultured with naïve CFSE-labeled OT-I cells. Proliferation of OT-I cells in culture was assessed 72 h later by flow cytometry. These results are representative of three independent experiments. (c) C57BL/6 mice were infected with PR8 and treated intranasally with 60 μg of soluble FITC-OVA 5 days after infection. The phenotype of FITC-labeled DCs was determined 16 h later by flow cytometry. Data are representative of three independent experiments (n = 4–5). (d,e) C57BL/6 mice were infected with PR8 and treated intranasally with PBS or 60 μg of soluble FITC-OVA 5 days later. DC subsets were purified from mLNs 16 h after OVA administration and were co-cultured with naïve CFSE-labeled OT-I cells without peptide (d) or with OVA257-264 (e). Proliferation of OTI cells in culture was assessed 72 h later by flow cytometry (d). These results are representative of three independent experiments. (fh) Mice were infected with PR8 and DC subsets were sorted from mLNs 5 days later. Purified CFSE-labeled OT-I cells (top) or CFSE-labeled OTII cells (bottom) were co-cultured with sorted DC subsets pulsed with 25 μg/ml of soluble OVA for 48 h (OT-I cells) or 72 h (OT-II cells). CFSE dilution was assayed by flow cytometry after gating on T cells (f). The number (mean ± SD) of proliferating CFSElo OT-I cells (g) or OT-II cells (h) was calculated. All values were obtained in triplicate and the results shown are representative of three independent experiments.
Figure 7
Figure 7. CD70 expression is a hallmark of CD103CD11bhi tDCs
(ac) C57BL/6 mice were infected intranasally with PR8 and the expression of CD40 (a), CD86 (b) and CD70 (c) on CD103+CD11blo and CD103CD11bhi tDCs was determined by flow cytometry. Values represent the mean ± SD of the mean fluorescence intensity (MFI) or percentage of positive cells (n = 4–5 mice/time point). Data are representative of three independent experiments. (d) C57BL/6 mice were infected intranasally with PR8 and the expression of CD70 on CD103+CD11blo and CD103CD11bhi tDCs in the mLNs was compared by flow cytometry at 24 h, 5 days and 12 days after infection. Data are representative of three independent experiments. (e) C57BL/6 mice were infected intranasally with PR8 and the frequency of CD70-expressing CD103CD11bhi tDCs in the lungs was determined by flow cytometry. Data are representative of three independent experiments. (f) C57BL/6 mice were infected intranasally with PR8 and 16 h prior to sacrifice, cells in the lung were labeled with CFSE by intranasal instillation. The frequency of CD70-expressing, CFSE-labeled CD103CD11bhi cells in the mLNs was determined by flow cytometry at the indicated times. Values represent the percentage (mean ± SD) of CD70-expressing, CFSE-labeled, CD103CD11bhi cells calculated for each time point (n = 4–5 mice / time point). Data are representative of three independent experiments. (g) C57BL/6 mice were infected intranasally with PR8 and injected with EdU 3 times, 6 h apart on day 6 after infection. The frequency of EdU-labeled cells in various CD8+ T cell subsets in the mLN was determined by flow cytometry 24 h after the first EdU injection. Plots are representative of two independent experiments (n = 5).
Figure 8
Figure 8. CD70 expression on CD103CD11bhi tDCs promotes the expansion of NP-specific CD8+ T cells
(a) C57BL/6 mice were infected with PR8 for 7 days, when CD103CD11bhi tDCs as well as CD8+ T cells were purified from mLNs. Purified CD8+ T cells were cocultured with sorted CD103CD11bhi tDC with 20 μg/ml of either CD70-specific blocking antibody (anti-CD70) or isotype control. The number (mean ± SD) of NP-specific CD8+ T cells was determined 96 h later by flow cytometry. All values were obtained in triplicate. The results shown are representative of three independent experiments. (b) C57BL/6 mice were infected with PR8 for 7 days, when CD103CD11bhi tDCs were sorted from mLNs, pulsed with 25 μg/ml of soluble OVA and co-cultured for 48 h with naïve CFSE-labeled OT-I cells with 20 μg/ml of either anti-CD70 or isotype control. The number (mean ± SD) of proliferating CFSElo T cells was determined by flow cytometry. All values were obtained in triplicate. The results shown are representative of two independent experiments. (c) C57BL/6 mice were infected with PR8 and starting on day 4, mice were treated with 500 μg of either anti-CD70 or control antibody. The frequency of NP-specific CD8+ T cells in the mLN was determined by flow cytometry on day 10 after infection and the total numbers of NP-specific CD8+ T cells were calculated. Data are representative of two independent experiments.

References

    1. Jung S, et al. In vivo depletion of CD11c+ dendritic cells abrogates priming of CD8+ T cells by exogenous cell-associated antigens. Immunity. 2002;17:211–220. - PMC - PubMed
    1. Heath WR, et al. Cross-presentation, dendritic cell subsets, and the generation of immunity to cellular antigens. Immunol Rev. 2004;199:9–26. - PubMed
    1. Villadangos JA, Schnorrer P. Intrinsic and cooperative antigen-presenting functions of dendritic-cell subsets in vivo. Nat Rev Immunol. 2007;7:543–555. - PubMed
    1. Palm NW, Medzhitov R. Pattern recognition receptors and control of adaptive immunity. Immunol Rev. 2009;227:221–233. - PubMed
    1. Hendriks J, et al. CD27 is required for generation and long-term maintenance of T cell immunity. Nat Immunol. 2000;1:433–440. - PubMed

Publication types

MeSH terms

Substances