

Hydrogen-bond driven loop-closure kinetics in unfolded polypeptide chains
- PMID: 20098498
- PMCID: PMC2799665
- DOI: 10.1371/journal.pcbi.1000645
Hydrogen-bond driven loop-closure kinetics in unfolded polypeptide chains
Abstract
Characterization of the length dependence of end-to-end loop-closure kinetics in unfolded polypeptide chains provides an understanding of early steps in protein folding. Here, loop-closure in poly-glycine-serine peptides is investigated by combining single-molecule fluorescence spectroscopy with molecular dynamics simulation. For chains containing more than 10 peptide bonds loop-closing rate constants on the 20-100 nanosecond time range exhibit a power-law length dependence. However, this scaling breaks down for shorter peptides, which exhibit slower kinetics arising from a perturbation induced by the dye reporter system used in the experimental setup. The loop-closure kinetics in the longer peptides is found to be determined by the formation of intra-peptide hydrogen bonds and transient beta-sheet structure, that accelerate the search for contacts among residues distant in sequence relative to the case of a polypeptide chain in which hydrogen bonds cannot form. Hydrogen-bond-driven polypeptide-chain collapse in unfolded peptides under physiological conditions found here is not only consistent with hierarchical models of protein folding, that highlights the importance of secondary structure formation early in the folding process, but is also shown to speed up the search for productive folding events.
Conflict of interest statement
The authors have declared that no competing interests exist.
Figures
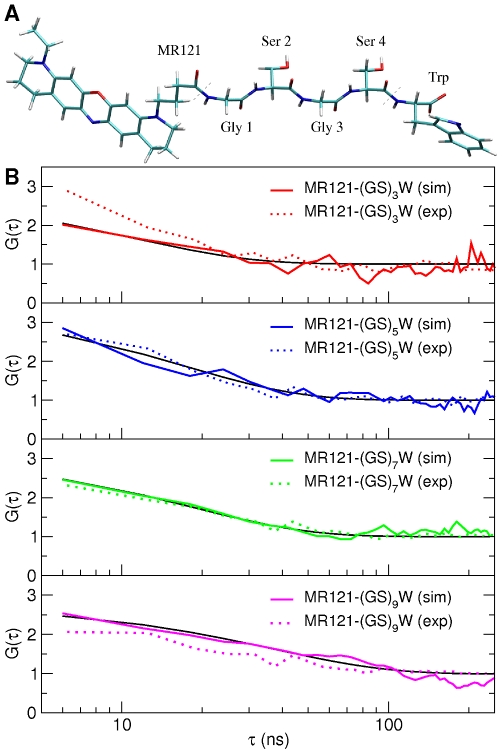
 peptide. B) Autocorrelation functions, G(
 ) (Eq. 1), calculated from experiment and simulation for four different labelled peptides in the 6–300 ns time range. In black are shown the fits (Eq. 2) to the simulation-derived profiles.
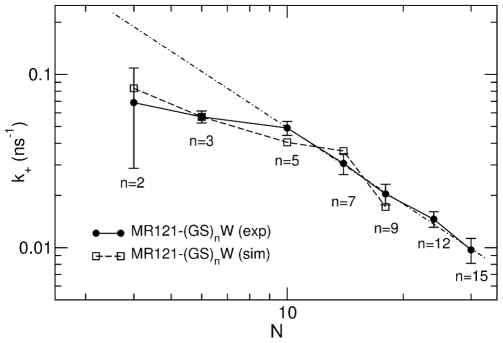
 evaluated from experimental- and simulation-derived autocorrelation functions in the 6–300 ns time range for labelled peptides as a function of the number of peptide bonds,
  . The dotted-dashed line shows the fit of a power-law function with exponent −1.4 to the experimental data for peptides with
  .
.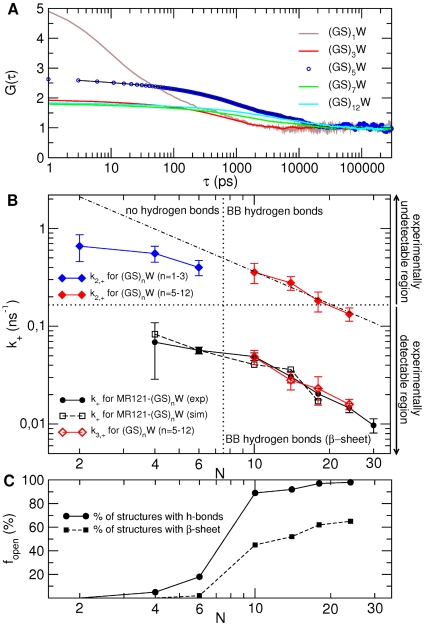
 ), evaluated from simulation for unlabelled peptides with
  , 3, 5, 7 and 12. The curves were fitted as described in the caption of Table 2 (for clarity, the fit is shown only for the
  peptide - dashed black line). B) Corresponding loop-closure rate constants,
  and
and  , are reported in the upper and lower half, respectively, as a function of the number of peptide bonds,
  . For comparison are shown in black the
  of the labelled peptides evaluated from the experiment (circles) and simulation (open squares). Note that fitting the G(
 ) of the unlabelled peptides as in the experiment, i.e., in the 6–300 ns time range, yields
  values within the error of the
  evaluated from the multiexponential fit described in Table 2. The dotted-dashed line shows the fit of a power-law function to the
  of unlabelled peptides with
  . C) Fraction of structures in the open state that possesses peptide hydrogen bonds (solid line) and
  -sheet structure (dashed line).
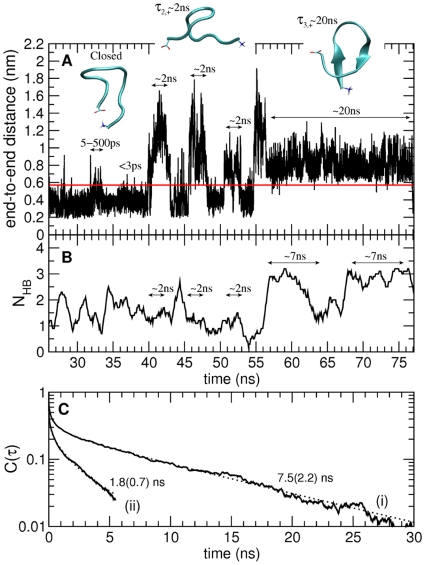
 ps;
ps;  –500 ps;
  ns;
ns;  ns. Representative structures of the closed and open states are shown. B) Number of intra-backbone hydrogen bonds. C) Hydrogen bond existence autocorrelation function,
  , shown for two different kinds of hydrogen bonds present in open configurations: hydrogen bonds involved (i) and not involved (ii) in
  -sheet structure. Each of the two
  was fitted with a sum of a stretched exponential (in the picosecond time-range) and a single exponential (in the nanosecond time-range). Relaxation times in the nanosecond time-range are taken as the average hydrogen bond lifetimes and are shown in the figure. Errors are indicated in parentheses and correspond to one standard deviation obtained from 2 independent trajectories. Correlation coefficients were higher than 0.99.
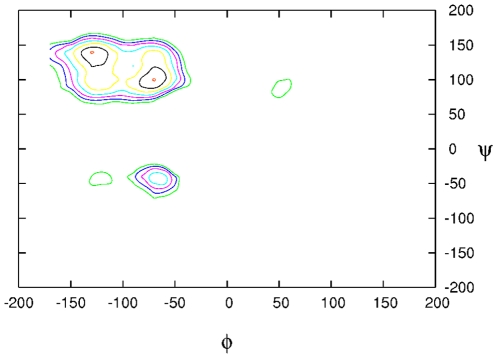
 distribution of backbone conformations of all nonglycine residues evaluated from simulation for the
  unlabelled peptide. The plot is also representative for the other peptides. The most populated regions are the
  -sheet (at around −135°;135°) and polyproline II, PPII, (at around −75°; 140°) regions.
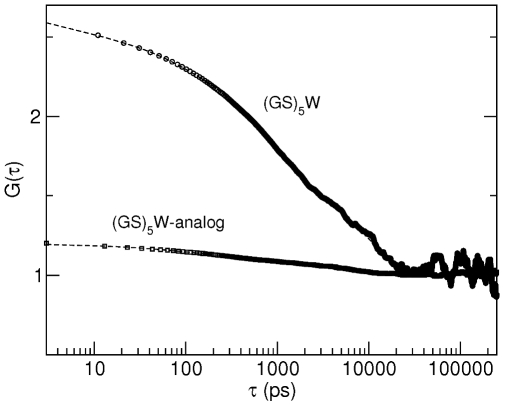
 ), evaluated from simulation for the unlabelled
  peptide and for a
  -analog that was simulated in the same conditions as the
  peptide, but with all the charges of the backbone atoms set to zero (except for the two termini). The curves were fitted as described in the caption of Table 2.
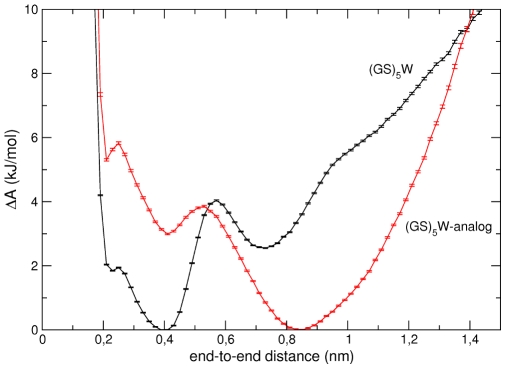
 peptide (black) and for the uncharged
  -analog (red). The errors bars correspond to one standard deviation obtained from 2 independent trajectories.
Similar articles
-
Backbone-driven collapse in unfolded protein chains.J Mol Biol. 2011 Jun 3;409(2):250-62. doi: 10.1016/j.jmb.2011.03.066. Epub 2011 Apr 8. J Mol Biol. 2011. PMID: 21497607
-
End-to-end distance distributions and intrachain diffusion constants in unfolded polypeptide chains indicate intramolecular hydrogen bond formation.Proc Natl Acad Sci U S A. 2006 Aug 15;103(33):12394-9. doi: 10.1073/pnas.0604748103. Epub 2006 Aug 7. Proc Natl Acad Sci U S A. 2006. PMID: 16894178 Free PMC article.
-
Dynamics of unfolded polypeptide chains in crowded environment studied by fluorescence correlation spectroscopy.J Mol Biol. 2007 Jan 19;365(3):856-69. doi: 10.1016/j.jmb.2006.10.021. Epub 2006 Nov 7. J Mol Biol. 2007. PMID: 17084857
-
Polypeptide chain collapse and protein folding.Arch Biochem Biophys. 2013 Mar;531(1-2):24-33. doi: 10.1016/j.abb.2012.10.003. Epub 2012 Oct 19. Arch Biochem Biophys. 2013. PMID: 23085151 Review.
-
Fast kinetics and mechanisms in protein folding.Annu Rev Biophys Biomol Struct. 2000;29:327-59. doi: 10.1146/annurev.biophys.29.1.327. Annu Rev Biophys Biomol Struct. 2000. PMID: 10940252 Free PMC article. Review.
Cited by
-
Force field-dependent solution properties of glycine oligomers.J Comput Chem. 2015 Jun 30;36(17):1275-85. doi: 10.1002/jcc.23934. Epub 2015 May 7. J Comput Chem. 2015. PMID: 25952623 Free PMC article.
-
Covalent dye attachment influences the dynamics and conformational properties of flexible peptides.PLoS One. 2017 May 23;12(5):e0177139. doi: 10.1371/journal.pone.0177139. eCollection 2017. PLoS One. 2017. PMID: 28542243 Free PMC article.
-
Universality in the timescales of internal loop formation in unfolded proteins and single-stranded oligonucleotides.Biophys J. 2010 Dec 15;99(12):3959-68. doi: 10.1016/j.bpj.2010.11.017. Biophys J. 2010. PMID: 21156138 Free PMC article.
-
Microsecond sub-domain motions and the folding and misfolding of the mouse prion protein.Elife. 2019 Apr 26;8:e44766. doi: 10.7554/eLife.44766. Elife. 2019. PMID: 31025940 Free PMC article.
-
Hydrophobic-hydrophilic forces in protein folding.Biopolymers. 2017 Aug;107(8):10.1002/bip.23020. doi: 10.1002/bip.23020. Biopolymers. 2017. PMID: 28387920 Free PMC article.
References
-
- Kubelka J, Hofrichter J, Eaton WA. The protein folding ‘speed limit’. Curr Opin Struct Biol. 2004;14:76–88. - PubMed
-
- Qi PX, Sosnick TR, Englander SW. The burst phase in ribonuclease a folding and solvent dependence of the unfolded state. Nat Struct Biol. 1998;5:882–884. - PubMed
-
- Baldwin RL. A new perspective on unfolded proteins. Adv Prot Chem. 2002;62:361–367. - PubMed
-
- Zagrovic B, Snow CD, Khaliq S, Shirts MR, Pande VS. Native-like mean structure in the unfolded ensemble of small proteins. J Mol Biol. 2002;323:153–64. - PubMed
Publication types
MeSH terms
Substances
LinkOut - more resources
Full Text Sources
