. 2010 Jan 21;5(1):e8820.
doi: 10.1371/journal.pone.0008820.

ChIP-chip designs to interrogate the genome of Xenopus embryos for transcription factor binding and epigenetic regulation

Affiliations

ChIP-chip designs to interrogate the genome of Xenopus embryos for transcription factor binding and epigenetic regulation

Robert C Akkers et al. PLoS One. .

Abstract

Background: Chromatin immunoprecipitation combined with genome tile path microarrays or deep sequencing can be used to study genome-wide epigenetic profiles and the transcription factor binding repertoire. Although well studied in a variety of cell lines, these genome-wide profiles have so far been little explored in vertebrate embryos.

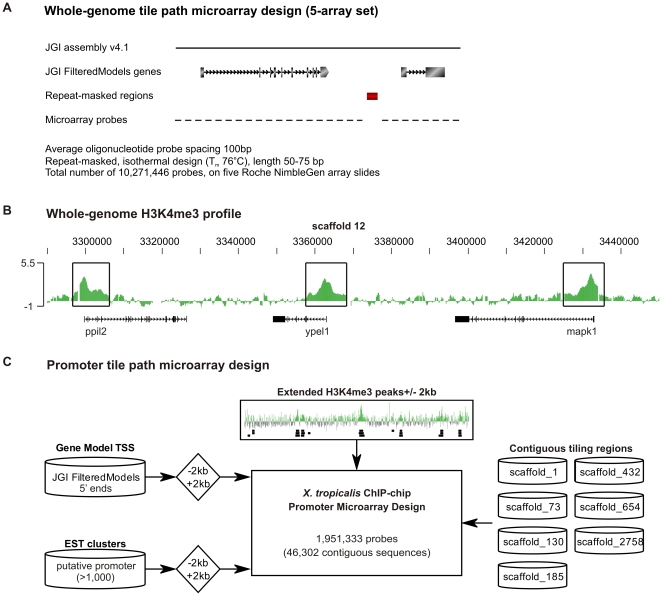
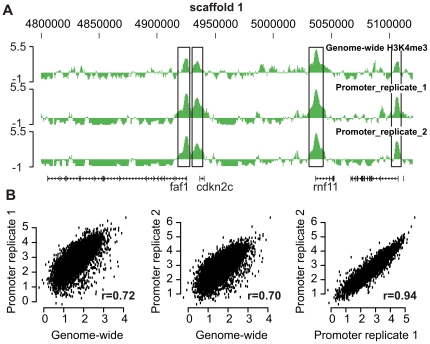
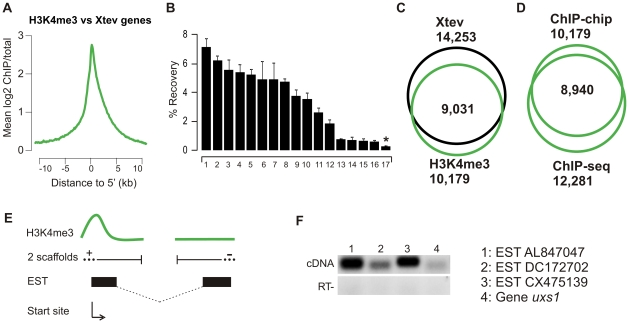
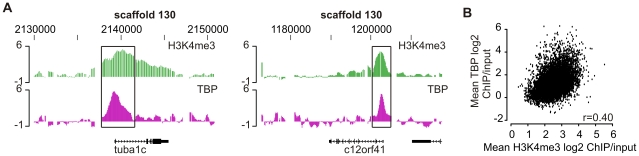
Principal findings: Here we report on two genome tile path ChIP-chip designs for interrogating the Xenopus tropicalis genome. In particular, a whole-genome microarray design was used to identify active promoters by close proximity to histone H3 lysine 4 trimethylation. A second microarray design features these experimentally derived promoter regions in addition to currently annotated 5' ends of genes. These regions truly represent promoters as shown by binding of TBP, a key transcription initiation factor.

Conclusions: A whole-genome and a promoter tile path microarray design was developed. Both designs can be used to study epigenetic phenomena and transcription factor binding in developing Xenopus embryos.


Conflict of interest statement

Competing Interests: Roche NimbleGen, Inc. contributed reagents and expertise for the experiments presented in this paper and may benefit financially from publication of the results. JRM and RDG were employed by Roche NimbleGen, Inc.

Figures

Figure 1
Figure 1. Whole-genome H3K4me3 ChIP-chip of gastrula embryos.
(A) Overview of the whole-genome tile path microarray design. (B) H3K4me3 profile for peptidylprolyl isomerase cyclophilin-like 2 (ppil2), yippee-like 1 (ypel1) and mitogen-activated protein kinase 1 (mapk1) that are enriched with H3K4me3 signals at the 5′ end visualized using the UCSC Genome Browser. (C) Overview of the promoter tile path microarray design.
Figure 2
Figure 2. Promoter microarray H3K4me3 ChIP-chip.
(A) Part of scaffold_1 is visualized using the UCSC Genome Browser. The four H3K4me3 enriched regions; Fas associated factor 1 (faf1), cyclin-dependent kinase inhibitor 2C (cdkn2c), ring finger protein 11 (rnf11) and an unknown protein are preserved in the three independent experiments. (B) Correlation of the genome-wide tiling and promoter microarray design ChIP-chip experiments; Pearson correlation r = 0.72, 0.70 and 0.94 respectively (p<2.2 * 10−16).
Figure 3
Figure 3. Analyses of H3K4me3 triplicate.
(A) Distributions of H3K4me3 at annotated Xtev genes. (B) ChIP-qPCR validation of randomly selected enriched H3K4me3 regions on three new generated biological replicates. 16 out of 17 of H3K4me3 enriched regions are validated as true positives with an average enrichment >2.5-fold over background (genomic locus on scaffold_1:6458583-6458633). Asterisk indicates a locus with <2.5-fold enrichment (experimental FDR <0.06). Error bars represent the SEM of three independent ChIP experiments. (C) Overlap of H3K4me3-enriched regions and Xtev genes (p<10−25). (D) Overlap of H3K4me3 ChIP-chip and ChIP-seq peaks. Of the peaks found with ChIP-chip, 88% are also detected with ChIP-seq (p<10−25). (E) ‘Orphan’ H3K4me3 peaks linking different scaffolds. Schematic overview of orphan linkage of two scaffolds using H3K4me3 signals and the EST database. The start site is determined by the H3K4me3 peak and the transcription unit combined with the EST information of the other scaffold. (F) RT-PCR validation of ESTs linking two scaffolds using primers that align to two different scaffolds: scaffold 649 and 145 (EST AL847047), scaffold 675 and 1278 (EST DC172702), scaffold 716 and 1312 (EST CX475139) and scaffold 1393 and 307 (uxs1). cDNA used for validation was generated from RNA isolated from stage 11–12 embryos.
Figure 4
Figure 4. TBP-enrichment at loci of promoter microarray design.
(A) Independent genes visualized in the UCSC Genome Browser for H3K4me3 (green) and TBP (pink). Left panel represents tubulin, alpha 1c (tuba1c) and the right panel human chromosome 12 open reading frame 41 (c12orf41). (B) Correlation of H3K4me3 ChIP-chip and TBP promoter ChIP-chip. Spearman rank r = 0.40 (p<2.2 * 10−16).

Similar articles

Cited by

References

    1. Bennett S. Solexa Ltd. Pharmacogenomics. 2004;5:433–438. - PubMed
    1. Mendenhall EM, Bernstein BE. Chromatin state maps: new technologies, new insights. Curr Opin Genet Dev. 2008;18:109–115. - PMC - PubMed
    1. Ren B, Robert F, Wyrick JJ, Aparicio O, Jennings EG, et al. Genome-wide location and function of DNA binding proteins. Science. 2000;290:2306–2309. - PubMed
    1. Berger SL. Histone modifications in transcriptional regulation. Curr Opin Genet Dev. 2002;12:142–148. - PubMed
    1. Bernstein BE, Kamal M, Lindblad-Toh K, Bekiranov S, Bailey DK, et al. Genomic maps and comparative analysis of histone modifications in human and mouse. Cell. 2005;120:169–181. - PubMed

Publication types

Substances