

Intact cytoskeleton is required for small G protein dependent activation of the epithelial Na+ channel
- PMID: 20098689
- PMCID: PMC2809106
- DOI: 10.1371/journal.pone.0008827
Intact cytoskeleton is required for small G protein dependent activation of the epithelial Na+ channel
Abstract
Background: The Epithelial Na(+) Channel (ENaC) plays a central role in control of epithelial surface hydration and vascular volume. Similar to other ion channels, ENaC activity is regulated, in part, by cortical cytoskeleton. Besides, the cytoskeleton is an established target for small G proteins signaling. Here we studied whether ENaC activity is modulated by changes in the state of the cytoskeleton and whether cytoskeletal elements are involved in small G protein mediated increase of ENaC activity.
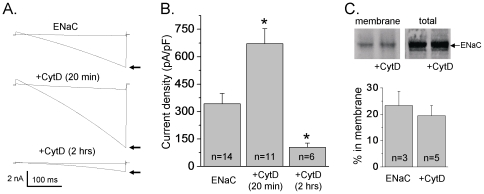
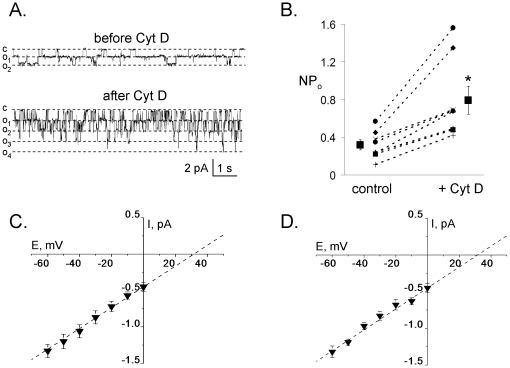
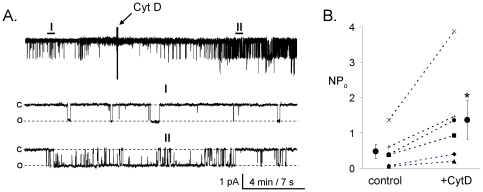
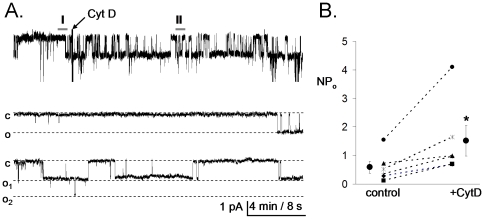
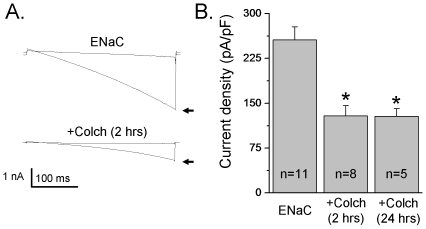
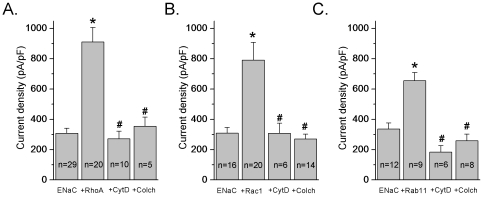
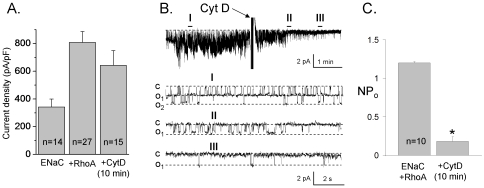
Methods and findings: First, the functional importance of the cytoskeleton was established with whole-cell patch clamp experiments recording ENaC reconstituted in CHO cells. Pretreatment with Cytochalasin D (CytD; 10 microg/ml; 1-2 h) or colchicine (500 microM; 1-3 h) to disassembly F-actin and destroy microtubules, respectively, significantly decreased amiloride sensitive current. However, acute application of CytD induced rapid increase in macroscopic current. Single channel measurements under cell-attached conditions revealed similar observations. CytD rapidly increased ENaC activity in freshly isolated rat collecting duct, polarized epithelial mouse mpkCCD(c14) cells and HEK293 cells transiently transfected with ENaC subunits. In contrast, colchicine did not have an acute effect on ENaC activity. Small G proteins RhoA, Rac1 and Rab11a markedly increase ENaC activity. 1-2 h treatment with colchicine or CytD abolished effects of these GTPases. Interestingly, when cells were coexpressed with ENaC and RhoA, short-term treatment with CytD decreased ENaC activity.
Conclusions: We conclude that cytoskeleton is involved in regulation of ENaC and is necessary for small G protein mediated increase of ENaC activity.
Conflict of interest statement
Figures
Similar articles
-
Effects of cytochrome P-450 metabolites of arachidonic acid on the epithelial sodium channel (ENaC).Am J Physiol Renal Physiol. 2011 Sep;301(3):F672-81. doi: 10.1152/ajprenal.00597.2010. Epub 2011 Jun 22. Am J Physiol Renal Physiol. 2011. PMID: 21697242 Free PMC article.
-
Novel role of Rac1/WAVE signaling mechanism in regulation of the epithelial Na+ channel.Hypertension. 2011 May;57(5):996-1002. doi: 10.1161/HYPERTENSIONAHA.110.157784. Epub 2011 Apr 4. Hypertension. 2011. PMID: 21464391
-
Quantifying RhoA facilitated trafficking of the epithelial Na+ channel toward the plasma membrane with total internal reflection fluorescence-fluorescence recovery after photobleaching.J Biol Chem. 2007 May 11;282(19):14576-85. doi: 10.1074/jbc.M701348200. Epub 2007 Mar 21. J Biol Chem. 2007. PMID: 17376773
-
[Mechanism of epithelial sodium channel (ENaC) regulation by cortactin: involvement of dynamin].Tsitologiia. 2011;53(11):903-10. Tsitologiia. 2011. PMID: 22332421 Russian.
-
Patch-clamp studies on epithelial sodium channels in salivary duct cells.Cell Biochem Biophys. 2002;36(2-3):105-13. doi: 10.1385/cbb:36:2-3:105. Cell Biochem Biophys. 2002. PMID: 12139396 Review.
Cited by
-
The Epithelial Sodium Channel and the Processes of Wound Healing.Biomed Res Int. 2016;2016:5675047. doi: 10.1155/2016/5675047. Epub 2016 Jul 14. Biomed Res Int. 2016. PMID: 27493961 Free PMC article. Review.
-
The actin cytoskeleton and small G protein RhoA are not involved in flow-dependent activation of ENaC.BMC Res Notes. 2010 Jul 27;3:210. doi: 10.1186/1756-0500-3-210. BMC Res Notes. 2010. PMID: 20663206 Free PMC article.
-
Effects of cytochrome P-450 metabolites of arachidonic acid on the epithelial sodium channel (ENaC).Am J Physiol Renal Physiol. 2011 Sep;301(3):F672-81. doi: 10.1152/ajprenal.00597.2010. Epub 2011 Jun 22. Am J Physiol Renal Physiol. 2011. PMID: 21697242 Free PMC article.
-
SECS, drugs, and Rac1&Rho: regulation of EnNaC in vascular endothelial cells.Pflugers Arch. 2025 Jul;477(7):977-992. doi: 10.1007/s00424-025-03093-5. Epub 2025 May 22. Pflugers Arch. 2025. PMID: 40402207 Free PMC article.
-
Involvement of Rho GTPases and their regulators in the pathogenesis of hypertension.Small GTPases. 2014;5(4):1-10. doi: 10.4161/sgtp.28846. Epub 2014 Oct 31. Small GTPases. 2014. PMID: 25496262 Free PMC article. Review.
References
-
- Alvarez de la Rosa D, Canessa CM, Fyfe GK, Zhang P. Structure and regulation of amiloride-sensitive sodium channels. Annu Rev Physiol. 2000;62:573–594. - PubMed
-
- Garty H, Palmer LG. Epithelial sodium channels: function, structure, and regulation. Physiol Rev. 1997;77:359–396. - PubMed
-
- Schild L. The epithelial sodium channel: from molecule to disease. Rev Physiol Biochem Pharmacol. 2004;151:93–107. - PubMed
-
- Bhalla V, Hallows KR. Mechanisms of ENaC regulation and clinical implications. J Am Soc Nephrol. 2008;19:1845–1854. - PubMed
-
- Takai Y, Sasaki T, Matozaki T. Small GTP-binding proteins. Physiol Rev. 2001;81:153–208. - PubMed
Publication types
MeSH terms
Substances
LinkOut - more resources
Full Text Sources
Research Materials
