. 2010 Jan 21;5(1):e8817.
doi: 10.1371/journal.pone.0008817.

Time-resolved and tissue-specific systems analysis of the pathogenesis of insulin resistance

Affiliations

Time-resolved and tissue-specific systems analysis of the pathogenesis of insulin resistance

Robert Kleemann et al. PLoS One. .

Abstract

Background: The sequence of events leading to the development of insulin resistance (IR) as well as the underlying pathophysiological mechanisms are incompletely understood. As reductionist approaches have been largely unsuccessful in providing an understanding of the pathogenesis of IR, there is a need for an integrative, time-resolved approach to elucidate the development of the disease.

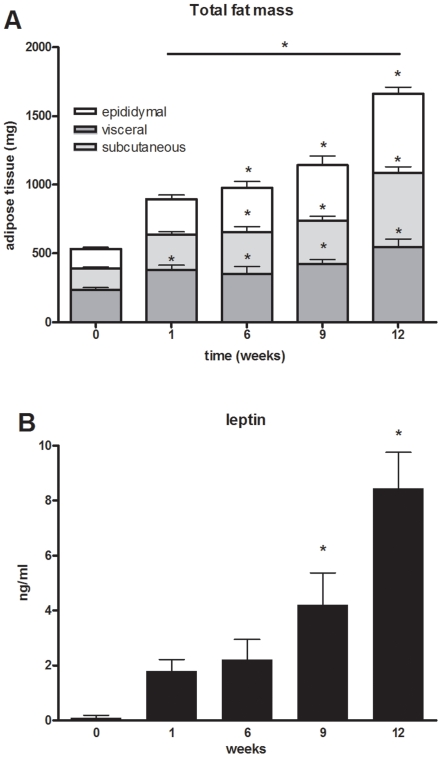
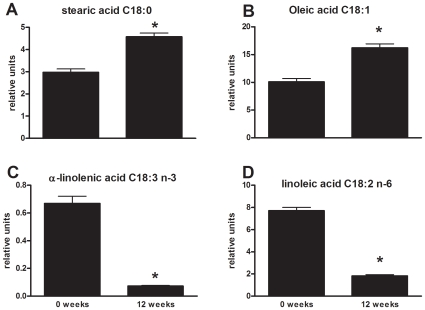
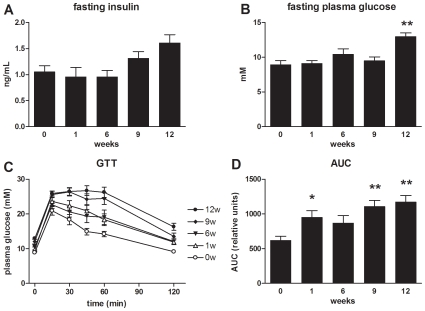
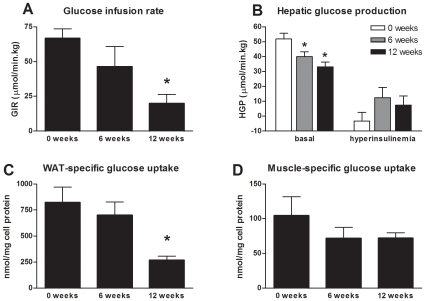
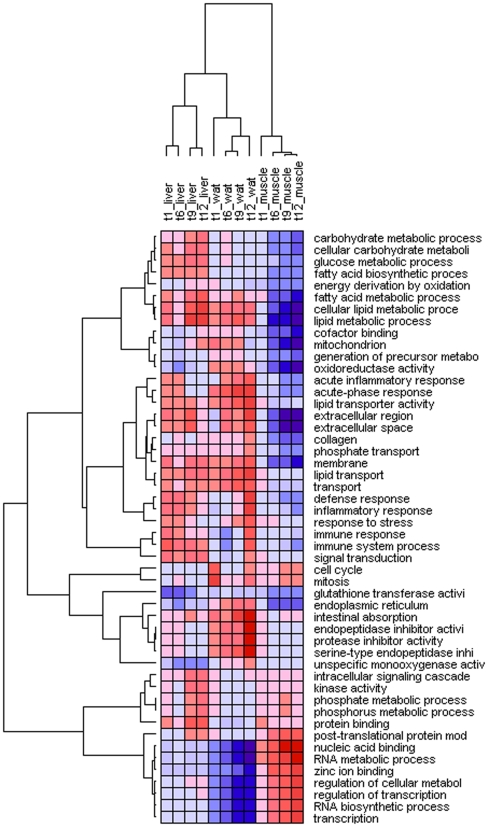
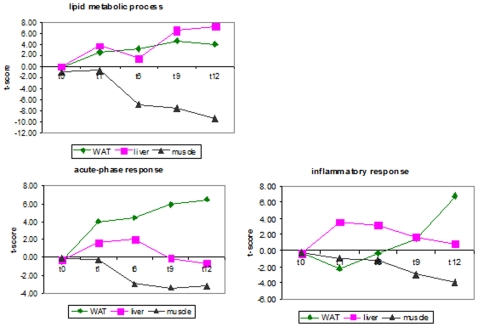
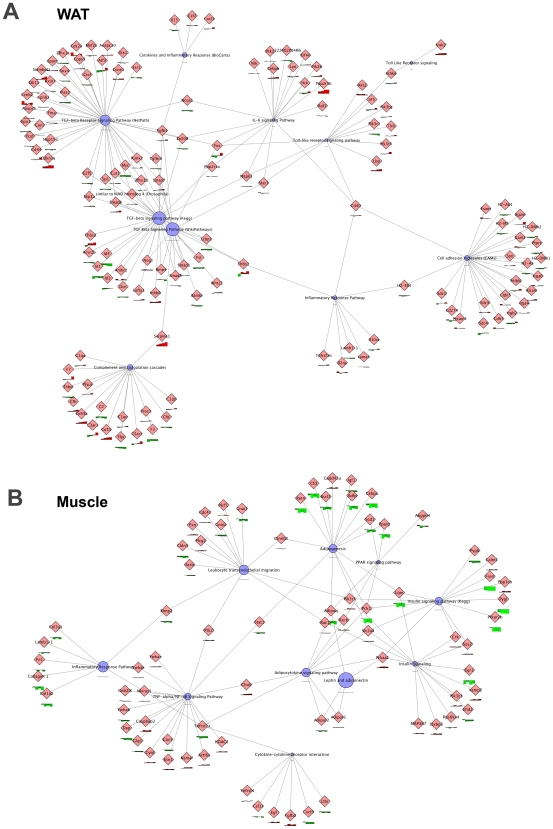
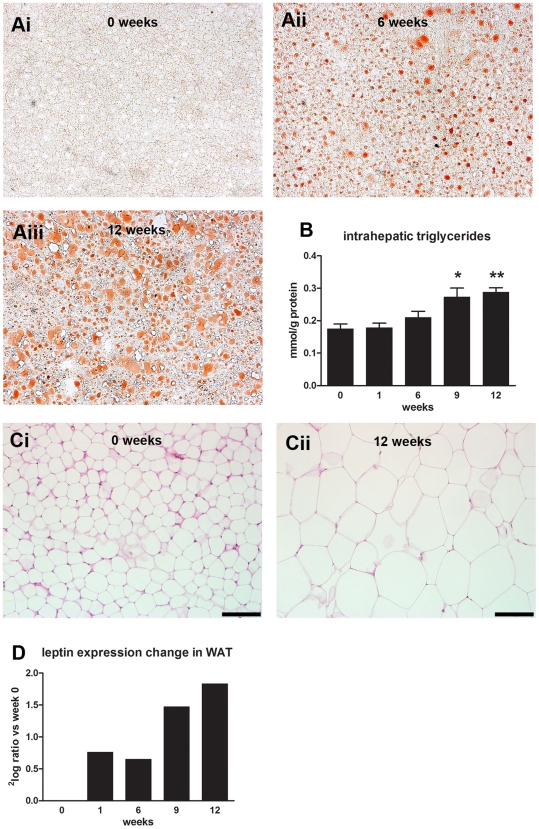
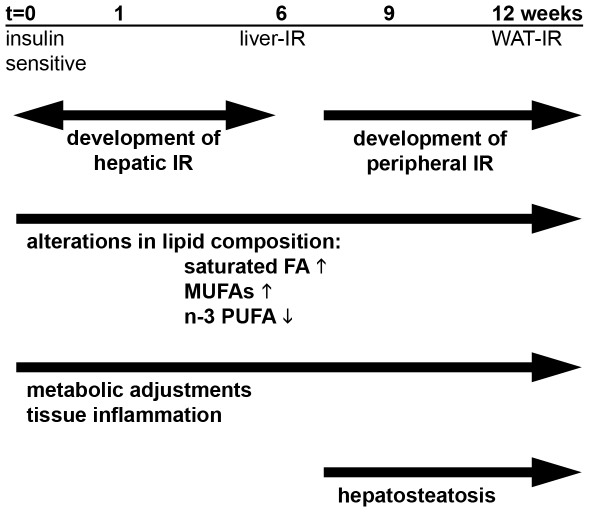
Methodology/principal findings: Male ApoE3Leiden transgenic mice exhibiting a humanized lipid metabolism were fed a high-fat diet (HFD) for 0, 1, 6, 9, or 12 weeks. Development of IR was monitored in individual mice over time by performing glucose tolerance tests and measuring specific biomarkers in plasma, and hyperinsulinemic-euglycemic clamp analysis to assess IR in a tissue-specific manner. To elucidate the dynamics and tissue-specificity of metabolic and inflammatory processes key to IR development, a time-resolved systems analysis of gene expression and metabolite levels in liver, white adipose tissue (WAT), and muscle was performed. During HFD feeding, the mice became increasingly obese and showed a gradual increase in glucose intolerance. IR became first manifest in liver (week 6) and then in WAT (week 12), while skeletal muscle remained insulin-sensitive. Microarray analysis showed rapid upregulation of carbohydrate (only liver) and lipid metabolism genes (liver, WAT). Metabolomics revealed significant changes in the ratio of saturated to polyunsaturated fatty acids (liver, WAT, plasma) and in the concentrations of glucose, gluconeogenesis and Krebs cycle metabolites, and branched amino acids (liver). HFD evoked an early hepatic inflammatory response which then gradually declined to near baseline. By contrast, inflammation in WAT increased over time, reaching highest values in week 12. In skeletal muscle, carbohydrate metabolism, lipid metabolism, and inflammation was gradually suppressed with HFD.

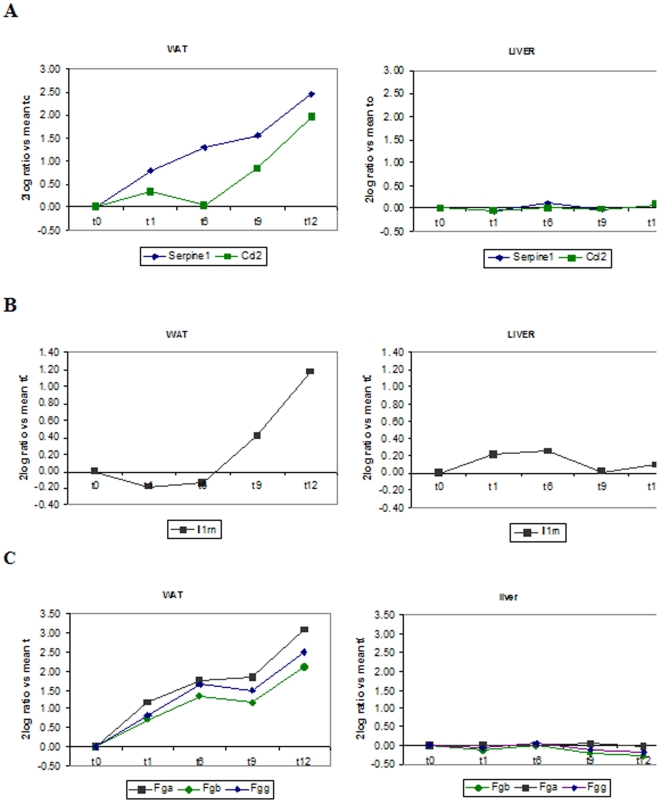
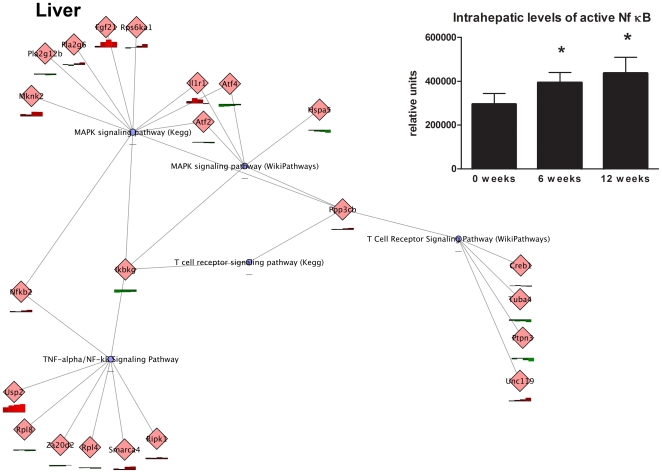
Conclusions/significance: HFD-induced IR is a time- and tissue-dependent process that starts in liver and proceeds in WAT. IR development is paralleled by tissue-specific gene expression changes, metabolic adjustments, changes in lipid composition, and inflammatory responses in liver and WAT involving p65-NFkB and SOCS3. The alterations in skeletal muscle are largely opposite to those in liver and WAT.


Conflict of interest statement

Competing Interests: Authors employed by TNO (R.K., M.v.E., A.J., L.V., A.M.v.d.H., M.K, P.Y.W, L.P., I.B.–P., K.T., S.W., N.C., B.v.O., and T.K.) and the Top Institute Food and Nutrition (R.K., P.Y.W., and K.T.) have a potential conflict of interest as their organizations may benefit from a product or patent generated on the basis of the published data. In these cases, the authors will however not receive additional salary, additional personal income, or any form of financial support.

Figures

Figure 1
Figure 1. Fat mass over time.
(A) Bars represent total fat mass subdivided into the epididymal, subcutaneous and visceral adipose tissue depots. Groups of n = 15 animals were sacrificed at the time points indicated to determine adipose mass of the various depots. Data are presented as means ± SEM. *P<0.05 indicates significance compared to t = 0 for each type of adipose tissue depot or the total fat mass. (B) Plasma leptin levels over time presented as means±SEM. *P<0.01 compared to t = 0.
Figure 2
Figure 2. HFD feeding alters the relative amount of saturated, monounsaturated and polyunsaturated fatty acids.
Free fatty acid analysis of plasma. Representative fatty acids of the C18 category (stearic acid, oleic acid, alpha-linolenic acid and linoleic acid) are shown. Data presented are relative amounts and values are means ± SEM. *P<0.001.
Figure 3
Figure 3. Effect of HFD feeding on fasting plasma insulin and glucose levels and glucose tolerance.
Plasma insulin (A) and glucose (B) levels determined after a 5 hr fasting period. A glucose tolerance test (GTT) (C) was performed 2.5 weeks prior to inclusion into the study (not shown) and each animal underwent a second GTT, in week 0, 1, 6, 9, and 12 of HFD feeding (n = 15 each). After a 5 h fast, animals received 2 g glucose/kg body weight (i.p.). Glucose was recorded at the time points indicated and the area under the curve (AUC) (D) was calculated. Values are means ± SEM. **P<0.01; *P<0.05
Figure 4
Figure 4. Glucose tolerance test and hyperinsulinemic, euglycemic clamp analysis.
In a parallel, independent animal experiment, HFD-fed mice were subjected to hyperinsulinemic, euglycemic clamp analysis. (A) shows the glucose infusion rate (GIR) under hyperinsulinemic conditions. Radioactive tracers allowed determining hepatic glucose production rate (HGP) (B) as well as the tissue-specific uptake of glucose into WAT (C) and skeletal muscle (D). ‘Basal’ indicates prior to hyperinsulinemic clamp conditions and ‘hyper’ indicates hyperinsulinemic clamp conditions. Values are means ± SEM. *P<0.05 vs. t = 0.
Figure 5
Figure 5. Time-resolved pathway analysis for liver, WAT and muscle.
Hierarchically clustered heat map of enriched functional groups of genes (Gene Ontology). Shown are functional groups of genes that are significantly enriched in at least one time point and tissue. Clustering analysis (Pearson correlation, complete linkage) was performed on average t-values for each time point. Red (blue) indicates up-regulation (down-regulation) of a functional group and a positive (negative) t-value. The color intensity reflects the magnitude of a change. Columns represent the different tissues over time and rows represent the functional clusters.
Figure 6
Figure 6. Analysis of biological processes in liver, WAT and muscle over time.
Response profiles of specific biological processes are shown together with their average t-scores.
Figure 7
Figure 7. WAT is an important source of inflammation.
Comparison of the expression of prototype inflammatory genes in WAT and liver. A, PAI-1 (Serpine1) and MCP-1 (Ccl2); B, IL-receptor antagonist (Ilm1) and C, Fibrinogen-alpha, -beta, -gamma in WAT (left) and liver (right). Data were confirmed in independent RT-PCR analyses.
Figure 8
Figure 8. Chronic inflammatory processes in liver modulated by HFD.
Transcriptomics data were analyzed by PathVisio with criterion ANOVA qvalue <0.01. Magnifications from the overall networks generated (not shown) illustrating the major inflammatory processes in liver. Red bars indicate upregulated differentially expressed genes, green bars indicated downregulated genes. Blue nodes represent biological processes. The insert shows the amount of active p65-NFkB in liver over time as assessed by TransAM analysis. Data are means ± SD. *P<0.05 compared to t = 0.
Figure 9
Figure 9. Chronic inflammatory processes in WAT and muscle modulated by HFD.
Transcriptomics data were analyzed by PathVisio with criterion ANOVA qvalue <0.01. Magnifications from the overall networks generated (not shown) illustrating the major inflammatory processes in WAT (A) as well as the major metabolic processes of skeletal muscle (B). Red bars indicate upregulated differentially expressed genes, green bars indicated downregulated genes. Blue nodes represent biological processes.
Figure 10
Figure 10. HFD feeding causes hepatosteatosis and WAT hypertrophy.
(A) Representative photomicrographs of Oil Red O-stained liver cross-sections at t = 0 (i), week 6 (ii) and week 12 (iii). (B) Analysis of intrahepatic triglycerides. Values are mean ± SEM *P<0.01 vs t = 0, **P<0.001 vs t = 0. (C) HPS-stained epididymal adipose tissue at t = 0 (i) and week 12 (ii). Biopsies from tissues also analyzed by microarray were used. Bars indicate 100 µm. (D) Leptin expression over time.
Figure 11
Figure 11. Overview of development of IR in ApoE3Leiden mice fed a HFD.
Weeks of HFD feeding are indicated together with the time point at which liver, and WAT developed IR. Changes in the lipid composition (ie. the quality and nature of fatty acids) occurred within the first 6 weeks and changes persisted until the end of the study. Extensive metabolic adjustments (indicating metabolic stress) and development of local inflammation in liver and WAT from week 1 onward. Hepatosteatosis developed after week 6.

References

    1. Kahn SE, Hull RL, Utzschneider KM. Mechanisms linking obesity to insulin resistance and type 2 diabetes. Nature. 2006;444:840–846. - PubMed
    1. Schenk S, Saberi M, Olefsky JM. Insulin sensitivity: modulation by nutrients and inflammation. J Clin Invest. 2008;118:2992–3002. - PMC - PubMed
    1. Hotamisligil GS. Inflammation and metabolic disorders. Nature. 2006;444:860–867. - PubMed
    1. Herder C, Kolb H, Koenig W, Haastert B, Muller-Scholze S, et al. Association of systemic concentrations of macrophage migration inhibitory factor with impaired glucose tolerance and type 2 diabetes: results from the Cooperative Health Research in the Region of Augsburg, Survey 4 (KORA S4). Diabetes Care. 2006;29:368–371. - PubMed
    1. Verschuren L, Kooistra T, Bernhagen J, Voshol PJ, Ouwens DM, et al. MIF Deficiency Reduces Chronic Inflammation in White Adipose Tissue and Impairs the Development of Insulin Resistance, Glucose Intolerance, and Associated Atherosclerotic Disease. Circ Res. 2009;105:99–107. - PMC - PubMed

Publication types

Substances