

Monitoring linked epidemics: the case of tuberculosis and HIV
- PMID: 20098716
- PMCID: PMC2808389
- DOI: 10.1371/journal.pone.0008796
Monitoring linked epidemics: the case of tuberculosis and HIV
Abstract
Background: The tight epidemiological coupling between HIV and its associated opportunistic infections leads to challenges and opportunities for disease surveillance.
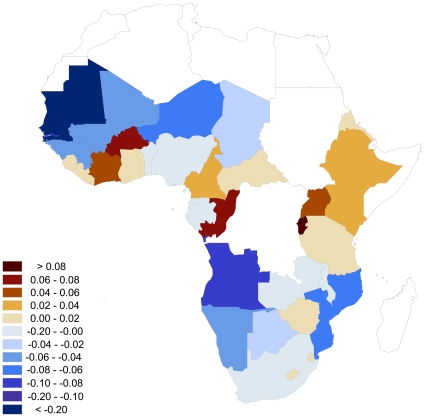
Methodology/principal findings: We review efforts of WHO and collaborating agencies to track and fight the TB/HIV co-epidemic, and discuss modeling--via mathematical, statistical, and computational approaches--as a means to identify disease indicators designed to integrate data from linked diseases in order to characterize how co-epidemics change in time and space. We present R(TB/HIV), an index comparing changes in TB incidence relative to HIV prevalence, and use it to identify those sub-Saharan African countries with outlier TB/HIV dynamics. R(TB/HIV) can also be used to predict epidemiological trends, investigate the coherency of reported trends, and cross-check the anticipated impact of public health interventions. Identifying the cause(s) responsible for anomalous R(TB/HIV) values can reveal information crucial to the management of public health.
Conclusions/significance: We frame our suggestions for integrating and analyzing co-epidemic data within the context of global disease monitoring. Used routinely, joint disease indicators such as R(TB/HIV) could greatly enhance the monitoring and evaluation of public health programs.
Conflict of interest statement
Figures
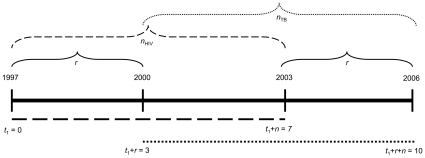
 in three different time intervals i = 1, 2 and 3. These intervals start before the novel intervention (with t
1 representing the first year for which we have data), when the novel intervention is first implemented (at year t
2), and for the period starting at the point when TB incidence first decreases in scenario A (at year t
3). Years t
2 and t
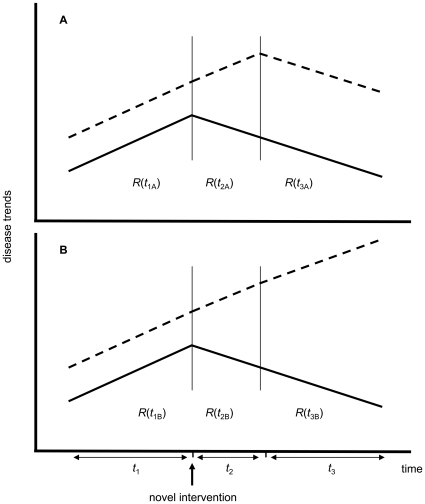
3 are represented by vertical lines. Because this diagram is a simple schematic we will not define exact values for the parameters ti, n and r. While in both scenarios HIV prevalence decreases, in (A) TB incidence decreases after a certain time lag such that (omitting subscripts and common argument values)
in three different time intervals i = 1, 2 and 3. These intervals start before the novel intervention (with t
1 representing the first year for which we have data), when the novel intervention is first implemented (at year t
2), and for the period starting at the point when TB incidence first decreases in scenario A (at year t
3). Years t
2 and t
3 are represented by vertical lines. Because this diagram is a simple schematic we will not define exact values for the parameters ti, n and r. While in both scenarios HIV prevalence decreases, in (A) TB incidence decreases after a certain time lag such that (omitting subscripts and common argument values)  , while in (B) TB incidence continues to increase and
  , indicating that TB control is not reaping the benefits anticipated from the new HIV control measure.
References
-
- Lloyd-Smith JO, Poss M, Grenfell BT. HIV-1/parasite co-infection and the emergence of new parasite strains. Parasitology. 2008;135:795–806. - PubMed
-
- Brooks JT, Kaplan JE, Holmes KK, Benson C, Pau A, et al. HIV-associated opportunistic infections–going, going, but not gone: the continued need for prevention and treatment guidelines. Clin Infect Dis. 2009;48:609–611. - PubMed
