. 2010 Jan 19;8(1):e1000282.
doi: 10.1371/journal.pbio.1000282.

A rho scaffold integrates the secretory system with feedback mechanisms in regulation of auxin distribution

Affiliations

A rho scaffold integrates the secretory system with feedback mechanisms in regulation of auxin distribution

Ora Hazak et al. PLoS Biol. .

Abstract

Development in multicellular organisms depends on the ability of individual cells to coordinate their behavior by means of small signaling molecules to form correctly patterned tissues. In plants, a unique mechanism of directional transport of the signaling molecule auxin between cells connects cell polarity and tissue patterning and thus is required for many aspects of plant development. Direction of auxin flow is determined by polar subcellular localization of PIN auxin efflux transporters. Dynamic PIN polar localization results from the constitutive endocytic cycling to and from the plasma membrane, but it is not well understood how this mechanism connects to regulators of cell polarity. The Rho family small GTPases ROPs/RACs are master regulators of cell polarity, however their role in regulating polar protein trafficking and polar auxin transport has not been established. Here, by analysis of mutants and transgenic plants, we show that the ROP interactor and polarity regulator scaffold protein ICR1 is required for recruitment of PIN proteins to the polar domains at the plasma membrane. icr1 mutant embryos and plants display an a array of severe developmental aberrations that are caused by compromised differential auxin distribution. ICR1 functions at the plasma membrane where it is required for exocytosis but does not recycle together with PINs. ICR1 expression is quickly induced by auxin but is suppressed at the positions of stable auxin maxima in the hypophysis and later in the embryonic and mature root meristems. Our results imply that ICR1 is part of an auxin regulated positive feedback loop realized by a unique integration of auxin-dependent transcriptional regulation into ROP-mediated modulation of cell polarity. Thus, ICR1 forms an auxin-modulated link between cell polarity, exocytosis, and auxin transport-dependent tissue patterning.


Conflict of interest statement

The authors have declared that no competing interests exist.

Figures

Figure 1
Figure 1. Compromised auxin distribution in icr1 roots.
(A) DR5::GUS in WT and 2 and 14-d-old icr1 seedlings. (B) DR5rev::ER-GFP in WT and 2-d-old icr1 seedlings. Note the displacement of the auxin maximum toward the root cup in icr1 (B) and the accumulation of auxin signal in the stele (A). In 14-d-old plants auxin did not reach the meristem and accumulated in the stele (A brackets). Bars correspond to 50 µm.
Figure 2
Figure 2. Columella specification in WT and icr1 roots.
Lugol's (IKI) staining was used for detection of starch granules in 2, 4, and 6 DAG WT and icr1 seedlings. In WT roots, the number of columella tiers containing starch granules increase with the age of seedlings (arrows). In icr1 roots, at 2 DAG, two tiers of cells containing starch granules could be detected (arrows), whereas at older stages starch granules staining decreased and almost completely disappears at 6 DAG (arrowhead). The bar corresponds to 50 µM for all images.
Figure 3
Figure 3. Patterning defects in icr1 embryos are associated with altered distribution of auxin.
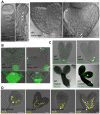
(A) Early and late patterning defects in icr1, as revealed by Nomarsky DIC of cleared embryos. Approximately 10% of icr1 embryos showed early developmental defects at the globular stage. Arrows denote abnormal cell divisions in the suspensor and hypophysis. The majority (90%) of the embryos developed normally up to the triangular stage. At the heart stage, abnormal cell divisions in the embryonic root meristem are seen (arrows). Note the non-steriotipic divisions of the protoderm in the cotyledons (arrowheads). (B) Auxin distribution in icr1 embryos revealed by the DR5rev::ER-GFP marker. Arrow indicates shift in auxin maxima toward the low columella layers. Arrowheads point to the strong auxin signals at the tip of the cotyledons. Insets are single confocal scans throughout the middle of the embryonic root meristem showing the reduced auxin accumulation in QC and upper columella layers. (C) Expression of the QC marker pWOX5::ER-GFP. Arrowheads denote altered accumulation in heart and mature icr1 embryos. (D) Expression of the endodermis marker pSCR::YFP-H2b. Arrowheads indicate spreading of the marker to adjacent cell layers in icr1. Bars correspond to 10 µm (A), 20 µm (B), and 50 µm (C and D). For additional information and high resolution images, see Figures S1, S2, S3, S4, S5, S6.
Figure 4
Figure 4. Abnormal expression of patterning markers in icr1 roots.
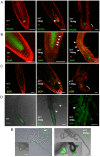
In icr1 roots, expression of the QC and stem cells markers pWOX5::ER-GFP (A), pSHR::YFP-SHR (B), and pSCR::YFP-H2b (C) spread to the neighboring cells in 2- to 4-d-old seedlings and was diminished in old (14-d-old) roots meristems and coincidently appeared at more apical locations at the sites of auxin accumulation (brackets). Note the expression and cytoplasmic localization of SHR in epidermis (arrowheads). (D) Expression pattern of pPIN1::GFP-PIN1 in WT and icr1 roots. Note the abnormal expression pattern of GFP-PIN1 in the epidermis and root hairs in icr1 roots (arrowheads). (E) Irregular spacing (right inset) and arrested growth of lateral roots soon after emergence seen in an icr1 mutant plant. Note the abnormal expression pattern of WOX5 in the icr1 lateral root primordia (insets). Bars correspond to 50 µm.
Figure 5
Figure 5. ICR1 is required for PIN polarity and membrane localization.
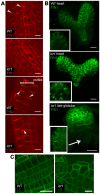
(A) Indirect immunofluorescence of roots with α-PIN1/PIN2 antibodies. Arrowheads denote the direction of PIN polarity. Note the changes in polarity of PIN1 in provascular tissue and of PIN2 in the cortex (arrow). (B) Localization and expression pattern of pPIN1::GFP-PIN1 in embryos. Projection of multiple confocal sections shows that the PIN1 polarity in provascular tissue and protoderm in heart-stage icr1 embryos is altered. Arrow indicates no expression at the basal side of the icr1 embryo with early patterning defects. Insets are single confocal scans throughout the region of future cotyledons. Note the reduced PIN1 polarity and large intracellular aggregations in heart stage icr1 embryo and almost complete loss of PIN1 membrane localization in embryo with early patterning defects. (C) Localization of the plasma membrane marker LTi-GFP is similar in roots of WT and icr1 seedlings. Bars correspond to 20 µm. For additional information and high resolution images, see Figures S8, S9, S10, S11.
Figure 6
Figure 6. Expression of ICR1 is induced by auxin but suppressed at the site of stable auxin maximum.
(A) ICR1 expression in embryos and roots. In globular and torpedo stage embryos, GFP-ICR1 expression is absent from the hypophysis and QC, respectively. A projection stack of multiple confocal scans through mature roots shows GFP-ICR1 expression in the root cup and epidermis, but a partial projection stack through the inner layers only reveals that GFP-ICR1 is absent from the QC and neighboring cells (arrowheads). (B) Regulation of ICR1 expression involves the ICR gene and/or protein. pICR1 driven GFP-rop6CA but not GFP-ICR1 was expressed in the QC and stem cells (arrowhead). (C) ICR1 expression in lateral roots. GFP-ICR1 expression is detected in lateral root (LR) founder cells and throughout LR development. Note the polarized localization of the GFP-ICR1 (arrowheads). (D) Subcellular localization of GFP-ICR1. Plasma membrane and polarized GFP-ICR1 localization in globular embryos GFP-ICR1 is detected in basal and periclinal membranes (arrowheads). In roots, GFP-ICR1 becomes progressively polarized as cells in the stele mature. (E) ICR1 expression is induced by auxin. Bar graph Q-PCR analysis showing induction of ICR1 expression within 30 min of incubation with auxin (10 µM NAA). Strong induction of pICR1-driven GFP-ICR1 expression detected 24 h after local auxin induction with 1 mm2 solid-medium particles with or without 10 µM NAA that were put 5 mm above the root tip. pICR1-driven GFP-ICR1 expression was suppressed by treatment with the auxin transport inhibitor NPA. Bars correspond to 10 µm for globular embryos (A and D) and 50 µm in all the other images. For additional information and high resolution images, see Figures S13, S14, S15, S16.
Figure 7
Figure 7. BFA-sensitive endocytic recycling is not affected in icr1 and GFP-ICR1 localization is insensitive to BFA.
(A, B) BFA treatments of embryos and roots stained with FM4-64, respectively. Arrowheads mark BFA compartments. Note that in icr1 BFA compartments are formed in all root tissues examined. (C) pPIN1::GFP-PIN1 co-localizes with FM4-64 in BFA compartments of WT and icr1 (arrowheads) root cells. (D) pICR1 driven GFP-ICR1 does not accumulate in FM4-64-labelled BFA bodies and its membrane localization is not affected by BFA treatments. Bars correspond to 10 µm (A) and 20 µm (B to D). For additional information, see Figure S10B.
Figure 8
Figure 8. Stability of PIN2-GFP labeled BFA bodies in WT and icr1 roots.
PIN2-GFP labeled BFA compartments in PIN2-GFP (A) and PIN2-GFP icr1 (C) epidermal and cortical layers treated with 50 µM BFA for 1 h PIN2-GFP (B) and PIN2-GFP icr1 (D) after 2 h BFA washout. (E) Percentage of epidermal cells with BFA bodies before and after BFA washout in PIN2-GFP and PIN2-GFP icr1. Error bars indicate SE; *** p≤0.001; Student's t test. Arrowheads mark BFA bodies. The scale bar corresponds to 10 µm for all images.
Figure 9
Figure 9. Localization of secGFP in icr1 roots.
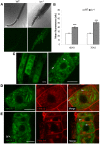
(A) Representative secGFP fluorescence images (two bottom panels) of WT and icr1 roots at 4 DAG imaged under identical conditions. White dotted lines on the DIC images (two upper panels) mark an area of 500 µm in length from the root tip that was used for quantification of the mean fluorescence shown in (B). (B) Mean fluorescence in WT and icr1 roots at 4 and 7 DAG. The mean fluorescence in icr1 roots was ∼1.5-fold stronger at 4 DAG and ∼2-fold stronger at 7 DAG. afu, arbitrary fluorescence units. Error bars correspond to SE; n≥20; *** fluorescence intensity was significantly different between WT and icr1 roots (p≤0.001; Student's t test). (C) Localization of secGFP in icr1 roots at 4 DAG. Note the accumulation of secGFP in punctuate structures (arrowheads). (D) secGFP (green) punctuate structures in icr1 were not co-localized with early/recycling endosomes marked with FM4-64 (red) (arrowheads). (E) secGFP (green) is not internalized into the BFA compartments marked by FM4-64 (red, arrowheads). Bars correspond to 100 µm in (A) and 10 µm in (C to E).

Comment in

Similar articles

Cited by

References

    1. Yalovsky S, Bloch D, Sorek N, Kost B. Regulation of membrane trafficking, cytoskeleton dynamics, and cell polarity by ROP/RAC GTPases. Plant Physiol. 2008;147:1527–1543. - PMC - PubMed
    1. Yang Z. Cell polarity signaling in Arabidopsis. Annu Rev Cell Dev Biol. 2008;24:551–575. - PMC - PubMed
    1. Bloch D, Lavy M, Efrat Y, Efroni I, Bracha-Drori K, et al. Ectopic expression of an activated RAC in Arabidopsis disrupts membrane cycling. Mol Biol Cell. 2005;16:1913–1927. - PMC - PubMed
    1. Jones M. A, Shen J. J, Fu Y, Li H, Yang Z, et al. The Arabidopsis Rop2 GTPase is a positive regulator of both root hair initiation and tip growth. Plant Cell. 2002;14:763–776. - PMC - PubMed
    1. Li H, Lin Y, Heath R. M, Zhu M. X, Yang Z. Control of pollen tube tip growth by a Rop GTPase-dependent pathway that leads to tip-localized calcium influx. Plant Cell. 1999;11:1731–1742. - PMC - PubMed

MeSH terms