Meta-Analysis
. 2010 Jan 19;7(1):e1000218.
doi: 10.1371/journal.pmed.1000218.

The relationship between anti-merozoite antibodies and incidence of Plasmodium falciparum malaria: A systematic review and meta-analysis

Affiliations
Meta-Analysis

The relationship between anti-merozoite antibodies and incidence of Plasmodium falciparum malaria: A systematic review and meta-analysis

Freya J I Fowkes et al. PLoS Med. .

Abstract

Background: One of the criteria to objectively prioritize merozoite antigens for malaria vaccine development is the demonstration that naturally acquired antibodies are associated with protection from malaria. However, published evidence of the protective effect of these antibodies is conflicting.

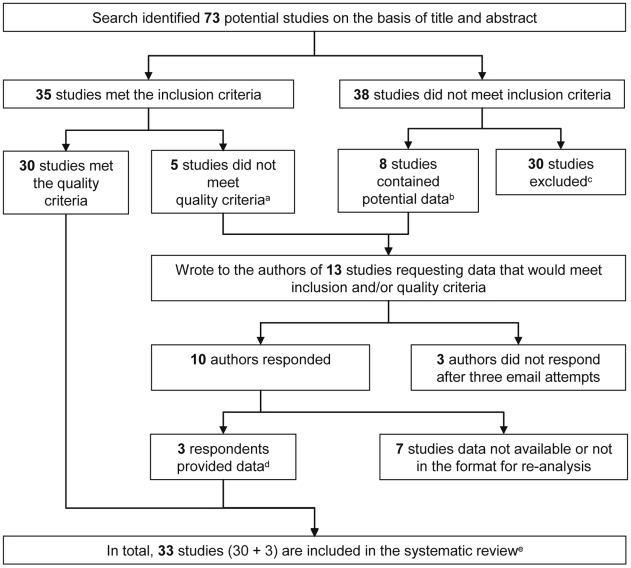
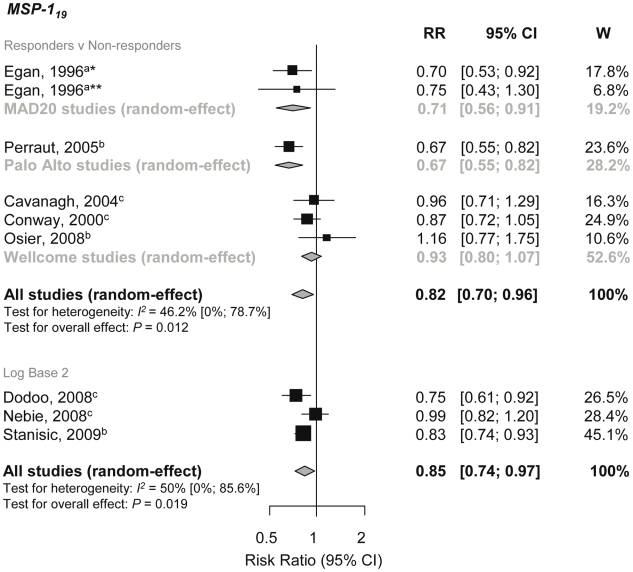
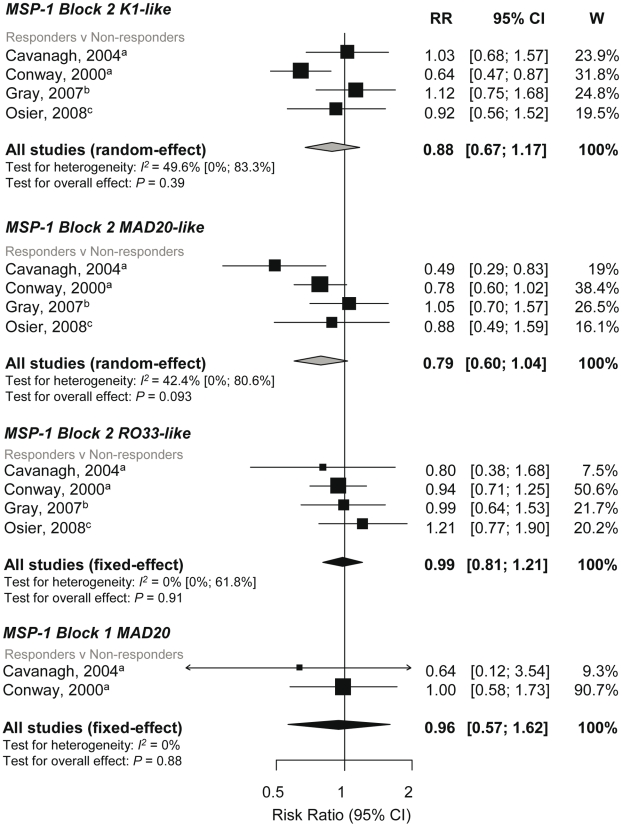
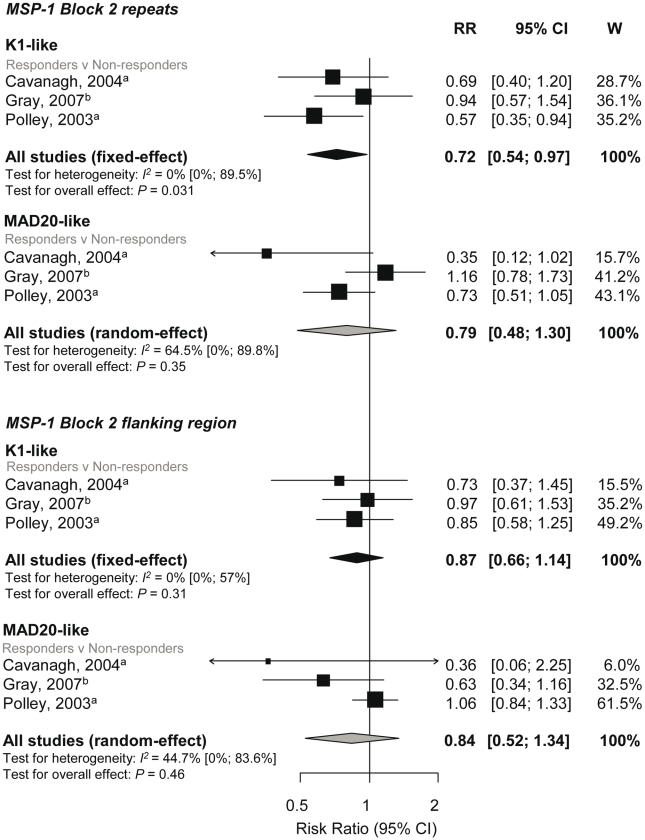
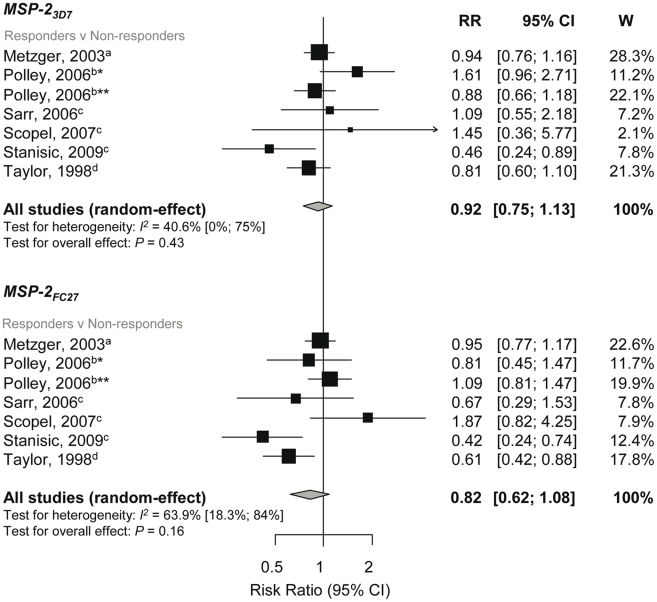
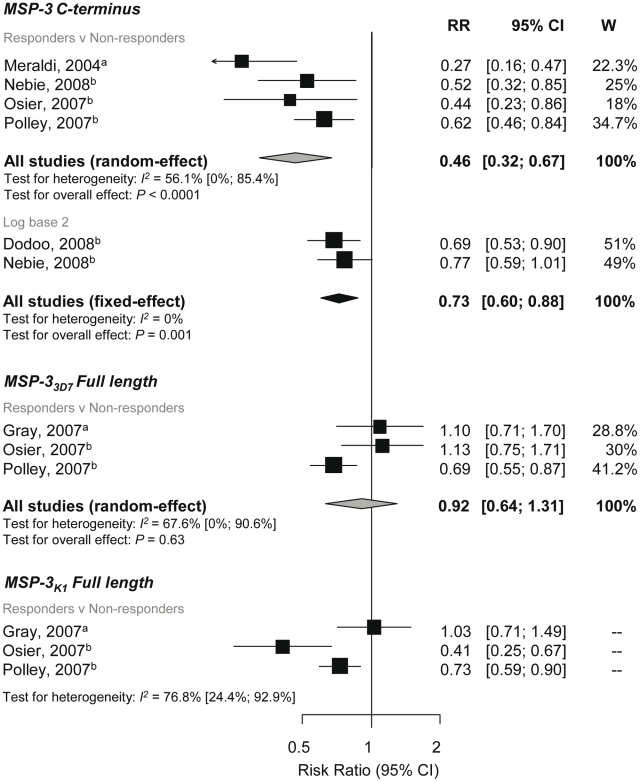
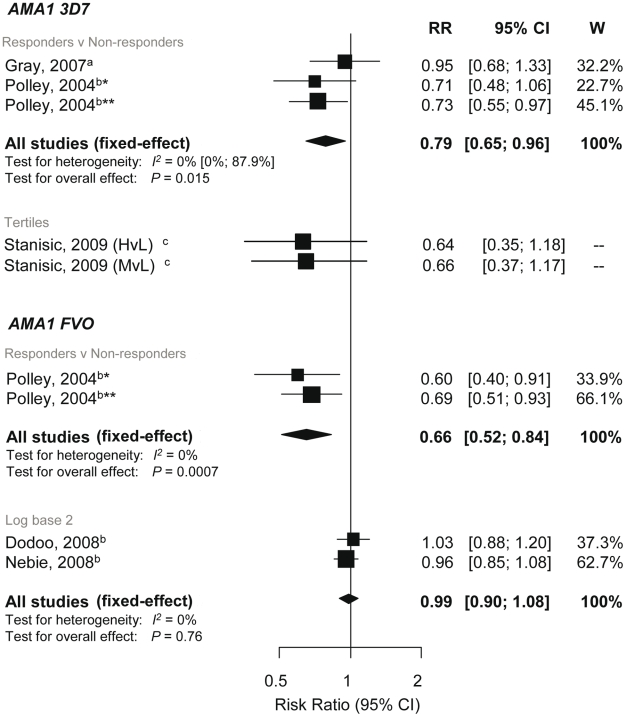
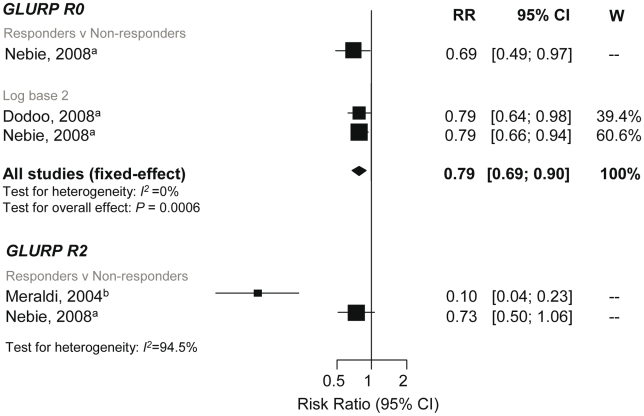
Methods and findings: We performed a systematic review with meta-analysis of prospective cohort studies examining the association between anti-merozoite immunoglobin (Ig) G responses and incidence of Plasmodium falciparum malaria. Two independent researchers searched six databases and identified 33 studies that met predefined inclusion and quality criteria, including a rigorous definition of symptomatic malaria. We found that only five studies were performed outside sub-Saharan Africa and that there was a deficiency in studies investigating antibodies to leading vaccine candidates merozoite surface protein (MSP)-1(42) and erythrocyte binding antigen (EBA)-175. Meta-analyses of most-studied antigens were conducted to obtain summary estimates of the association between antibodies and incidence of P. falciparum malaria. The largest effect was observed with IgG to MSP-3 C terminus and MSP-1(19) (responders versus nonresponders, 54%, 95% confidence interval [CI] [33%-68%] and 18% [4%-30%] relative reduction in risk, respectively) and there was evidence of a dose-response relationship. A tendency towards protective risk ratios (RR<1) was also observed for individual study estimates for apical membrane antigen (AMA)-1 and glutamate-rich protein (GLURP)-R0. Pooled estimates showed limited evidence of a protective effect for antibodies to MSP-1 N-terminal regions or MSP-1-EGF (epidermal growth factor-like modules). There was no significant evidence for the protective effect for MSP-2 (responders versus nonresponders pooled RR, MSP-2(FC27) 0.82, 95% CI 0.62-1.08, p = 0.16 and MSP-2(3D7) 0.92, 95% CI 0.75-1.13, p = 0.43). Heterogeneity, in terms of clinical and methodological diversity between studies, was an important issue in the meta-analysis of IgG responses to merozoite antigens.

Conclusions: These findings are valuable for advancing vaccine development by providing evidence supporting merozoite antigens as targets of protective immunity in humans, and to help identify antigens that confer protection from malaria. Further prospective cohort studies that include a larger number of lead antigens and populations outside Africa are greatly needed to ensure generalizability of results. The reporting of results needs to be standardized to maximize comparability of studies. We therefore propose a set of guidelines to facilitate the uniform reporting of malaria immuno-epidemiology observational studies. Please see later in the article for the Editors' Summary.


Conflict of interest statement

The authors have declared that no competing interests exist.

Figures

Figure 1
Figure 1. Flow chart of study identification.
Details of excluded studies can be found in Text S2. aDefinition of symptomatic malaria did not meet protocol definition; bAnalysed retro- and prospectively collected clinical data (n = 3), analysed antibody levels as outcome (n = 4,) and data presented on P. falciparum positive individuals only (n = 1); cReasons for exclusion: Data from seroprevalence surveys (n = 15); hospital-based study/recruited cases based on clinical/parasitemic status (n = 6); did not include malaria outcome of interest (n = 5); mother/infant studies (n = 3); measured IgG responses to undefined regions of antigens (n = 1); dScopel et al. (2007) provided data using a definition of symptomatic malaria that met our quality criteria, Sarr et al. (2006) provided data so P. falciparum could be analysed as outcome, and Osier et al. (2008) provided estimates for the whole cohort, whereas the manuscript originally presented data from P. falciparum-positive individuals only –; eThe characteristics of included studies are given in Table 1.
Figure 2
Figure 2. Forest plot of the association of MSP-119 responses with incidence of symptomatic P. falciparum malaria.
RRs correspond to risk of symptomatic P. falciparum malaria for MSP-119 responders versus nonresponders and per doubling of antibody responses (log base 2). RR<1 indicate that antibody responses are protective against symptomatic P. falciparum whereas RR>1 indicate susceptibility. aEstimates are calculated by authors from data in the paper; bdata supplied by original authors and calculated by current authors; cestimates are published estimates. All estimates are unadjusted with the exception of estimates from Nebie et al. (2008) and Dodoo et al. (2008), which are adjusted for age, and estimates from Stanisic (2009) are adjusted for age and spatial confounders ,,. W, weight. Note: Egan, 1996 had two study sites *Sierra-Leone and **The Gambia, and their analysis only included those with clinical disease versus asymptomatics, i.e., excluded those uninfected as they were assumed to be unexposed .
Figure 3
Figure 3. Forest plot of the association of MSP-1 block 2 and block 1 responses with incidence of symptomatic P. falciparum malaria.
RRs represent the risk of symptomatic P. falciparum malaria in IgG responders relative to nonresponders. RR<1 indicate that responders are protected from symptomatic P. falciparum whereas RR>1 indicate susceptibility. aEstimates are published estimates; bestimates are calculated by authors from data in the paper; cdata supplied by original authors and calculated by current authors. All reported estimates are unadjusted. W, weight.
Figure 4
Figure 4. Forest plot of the association of MSP-1-block 2 repeats and flanking region responses with incidence of symptomatic P. falciparum malaria.
RRs represent the risk of symptomatic P. falciparum malaria in IgG responders relative to nonresponders. RR<1 indicate that responders are protected from symptomatic P. falciparum whereas RR>1 indicate susceptibility. aEstimates are published estimates; bestimates are calculated by authors from data in the paper. All reported estimates are unadjusted. W, weight.
Figure 5
Figure 5. Forest plot of the association of MSP-2 responses with incidence of symptomatic P. falciparum malaria.
RR<1 indicate that responders are protected from symptomatic P. falciparum compared to nonresponders whereas RR>1 indicate susceptibility. aEstimates are published estimates; bconverted published estimate; cestimates are calculated by authors from data supplied by original author; destimates are calculated by authors from data in the paper. W, weight. Estimates reported are unadjusted with the exception of Stanisic (2009) (adjusted for spatial confounders and age) and Metzger (2003) (adjusted for age and preseason parasitaemia) ,. Note that estimates for Taylor (1998) are based on clinical and asymptomatic cases only (i.e., those uninfected were excluded on the basis they were unexposed) . Polley (2006) stratified for two study sites in Coastal Kenya, *Chonyi and **Ngerenya .
Figure 6
Figure 6. Forest plot of the association of MSP-3 responses with incidence of symptomatic P. falciparum malaria.
RR<1 indicate protection from symptomatic P. falciparum whereas RR>1 indicate susceptibility in responders versus nonresponders or per doubling of antibody responses. Estimates reported are unadjusted with the exception of Nebie (2008) (adjusted for age, sex, and village) and Nebie (2008) and Dodoo (2008) (adjusted for age) ,. aEstimates are calculated by authors from data in the paper; bestimates are published estimates. All reported estimates are unadjusted. W, weight.
Figure 7
Figure 7. Forest plot of the association of AMA-1 responses with incidence of symptomatic P. falciparum malaria.
RRs correspond to risk of symptomatic P. falciparum malaria for AMA1 responders versus nonresponders, High (H) and medium (M) versus low (L) responders (based on tertiles because sero-prevalence was high) and per doubling of antibody responses (log base 2). RR<1 indicate that antibody responses are protective against symptomatic P. falciparum whereas RR>1 indicate susceptibility. aEstimates are calculated by authors from data in the paper; bestimates are published estimates; cestimates supplied by the original authors. All estimates are unadjusted with the exception of Dodoo (2008) and Nebie (2008) with adjustments for age and Stanisic (2009) with adjustments for age and spatial confounders ,,. Polley (2004) stratified for two study sites in Coastal Kenya, *Chonyi and **Ngerenya.
Figure 8
Figure 8. Forest plot of the association of GLURP responses with incidence of symptomatic P. falciparum malaria.
RRs correspond to risk of symptomatic P. falciparum malaria for GLURP responders versus nonresponders and per doubling of antibody responses (log base 2). RR<1 indicate that antibody responses are protective against symptomatic P. falciparum whereas RR>1 indicate susceptibility. aEstimates are published estimates with adjustments for age, Nebie (2008) responder versus nonresponder analysis also adjusted for sex and village ; bestimates are calculated by authors from data in the paper. GLURP-R2 estimates were not combined because I 2>75%. W, weight.

References

    1. Marsh K, Kinyanjui S. Immune effector mechanisms in malaria. Parasite Immunol. 2006;28:51–60. - PubMed
    1. Cohen S, Mc GI, Carrington S. Gamma-globulin and acquired immunity to human malaria. Nature. 1961;192:733–737. - PubMed
    1. Sabchareon A, Burnouf T, Ouattara D, Attanath P, Bouharoun-Tayoun H, et al. Parasitologic and clinical human response to immunoglobulin administration in falciparum malaria. Am J Trop Med Hyg. 1991;45:297–308. - PubMed
    1. Cohen S, Butcher GA, Crandall RB. Action of malarial antibody in vitro. Nature. 1969;223:368–371. - PubMed
    1. Brown GV, Anders RF, Mitchell GF, Heywood PF. Target antigens of purified human immunoglobulins which inhibit growth of Plasmodium falciparum in vitro. Nature. 1982;297:591–593. - PubMed

Publication types

MeSH terms