

Structural analysis to determine the core of hypoxia response network
- PMID: 20098728
- PMCID: PMC2808224
- DOI: 10.1371/journal.pone.0008600
Structural analysis to determine the core of hypoxia response network
Abstract
The advent of sophisticated molecular biology techniques allows to deduce the structure of complex biological networks. However, networks tend to be huge and impose computational challenges on traditional mathematical analysis due to their high dimension and lack of reliable kinetic data. To overcome this problem, complex biological networks are decomposed into modules that are assumed to capture essential aspects of the full network's dynamics. The question that begs for an answer is how to identify the core that is representative of a network's dynamics, its function and robustness. One of the powerful methods to probe into the structure of a network is Petri net analysis. Petri nets support network visualization and execution. They are also equipped with sound mathematical and formal reasoning based on which a network can be decomposed into modules. The structural analysis provides insight into the robustness and facilitates the identification of fragile nodes. The application of these techniques to a previously proposed hypoxia control network reveals three functional modules responsible for degrading the hypoxia-inducible factor (HIF). Interestingly, the structural analysis identifies superfluous network parts and suggests that the reversibility of the reactions are not important for the essential functionality. The core network is determined to be the union of the three reduced individual modules. The structural analysis results are confirmed by numerical integration of the differential equations induced by the individual modules as well as their composition. The structural analysis leads also to a coarse network structure highlighting the structural principles inherent in the three functional modules. Importantly, our analysis identifies the fragile node in this robust network without which the switch-like behavior is shown to be completely absent.
Conflict of interest statement
Figures
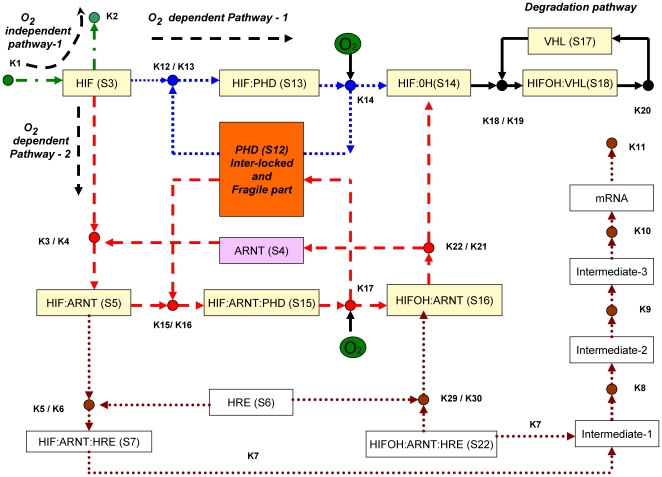
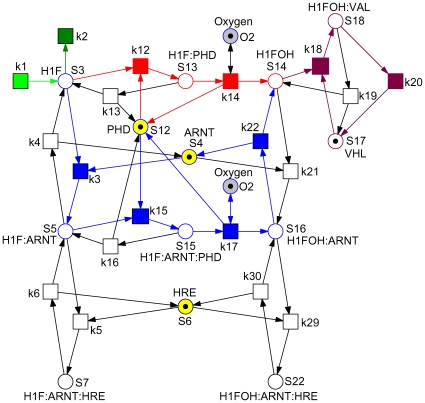
 are taken as transition identifiers in the structural analysis of the qualitative Petri net, and as kinetic parameters (see Table 2) in the simulative analysis of the continuous Petri net. There are two logical places for
  , connected to the remaining net by read arcs. See Table 1 for the biological meaning of the other place identifiers (dynamic variables). Each color characterizes an ADT set, compare Table 5. Reduction candidates, as revealed by invariant analysis, are uncolored.
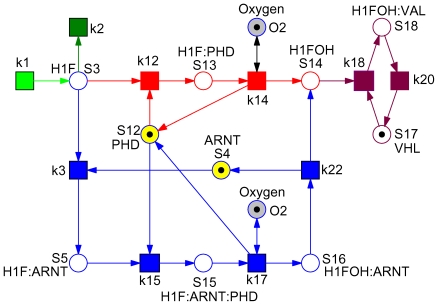
 ). Its knock-down would switch off
  and
and  . See also Figure 5.
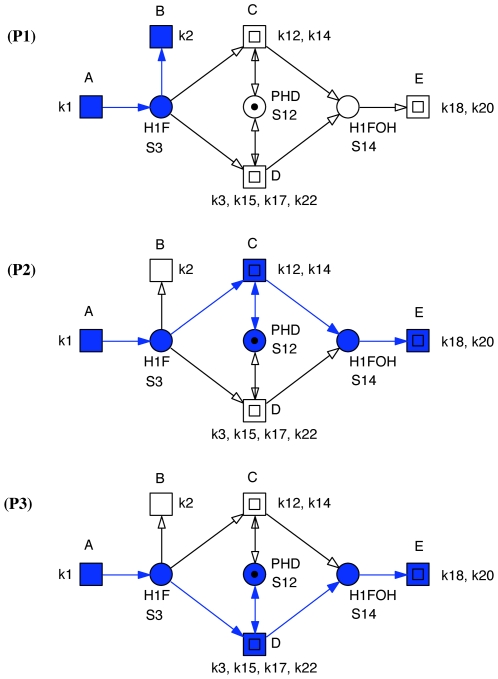
 – direct degradation: (
 ,
,  ),
),  – degradation not requiring ARNT (S4): (
 ,
,  ,
,  ), and
  – degradation requiring ARNT (S4): (
 ,
,  ,
,  ).
).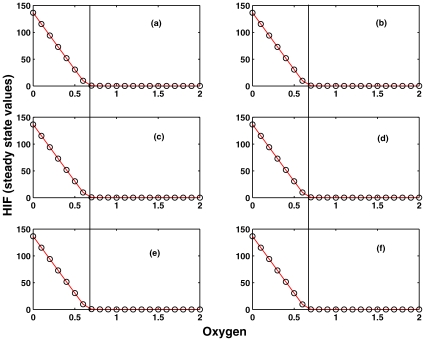
 ) on the oxygen concentration by systematic silencing network parts as determined by T-invariant analysis by setting sequentially kinetic parameters to zero. (a) full model according to ; (b) kinetic parameters set to zero:
  ; (c)
; (c)  +(b); (d)
  +(c); (e)
  +(d); (f)
  +(e). The experiment has been done for all three parameter sets as given in . The dark vertical black line indicates the critical oxygen concentration (
 0.65) for which HIF is completely degraded. It separates hypoxia (left) from normoxia (right). The SSV and the critical oxygen concentration are the same in (a)–(f). Therefore, (f) is considered as the core module for further analysis.
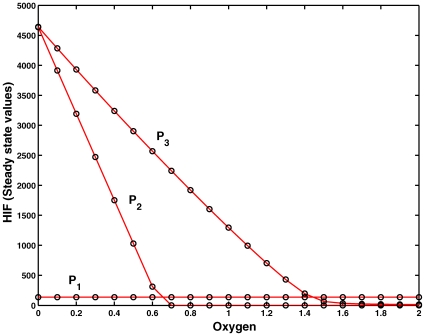
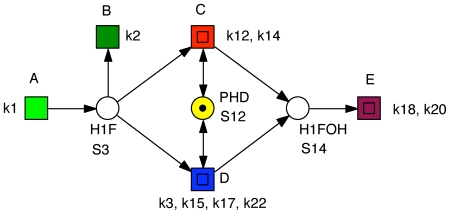
 ,
,  and
and  , see Table 4, determined by numerical integration of the ODEs defined by each pathway. The efficiency of degradation of HIF by oxygen can be ordered as
  .
.  is the oxygen-independent pathway.
  degrades more efficiently due to stronger binding of PHD to HIF than ARNT.
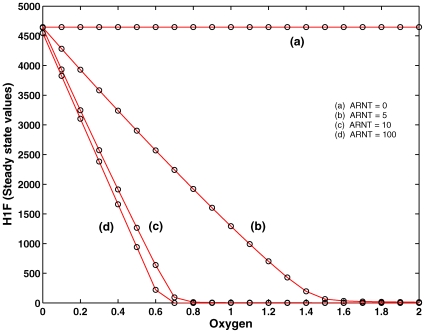
 is considered separately while varying ARNT initial concentration (
 ). Degradation of HIF through pathway P3 is feasible for low (5) and medium (10) initial concentration of ARNT. For extremely high concentration (100), saturation of HIF by ARNT takes place and thereby the critical oxygen concentration (complete degradation of HIF) does not change.
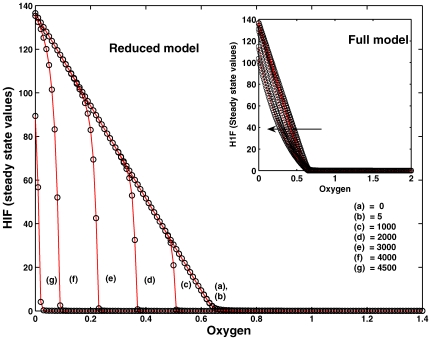
 ) in the reduced model to a wide range (0, 5, 1000 … 4500). SSV and critical oxygen concentration are not affected for a very low value of ARNT initial concentration. Extreme concentration of ARNT (1000, 2000 …) which is 100 or more times than that of PHD initial concentration (10) changes both the SSV and the critical oxygen concentration to a lower value and as a result the curves are shifted to the left. We also give the simulation of the full model for varying concentration of ARNT. The concentration change is indicated by the direction of the arrow. The qualitative behavior is the same as for the reduced core model. Even for very high ARNT concentration the critical oxygen concentration is retained, but the HIF steady state values are lowered.
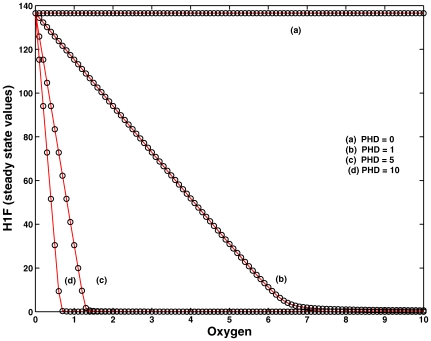
 ) in the core module of the network. Increase in PHD concentration sHIFts the critical oxygen concentration to a lower value delineating the importance of binding affinity of PHD-HIF complex for degradation. The loss of PHD knocks off the oxygen-dependent degradation pathways
  ,
,  and results in inefficient degradation by the oxygen-independent pathway
  only, suggesting that PHD is the fragile node in the core module.
 and three of its markings (states), connected each by a firing of the transition r. The transition is not enabled anymore in the marking reached after these two single firing steps.
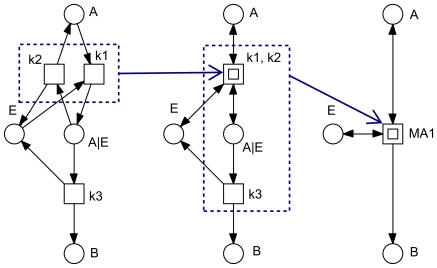
 . The transitions
  and
and  model a reversible reaction. Macro transitions (drawn as two centric squares) hide net details (in this case transition-bordered subnetworks) on the next lower hierarchy level. Macro transitions can be arbitrarily nested resulting into hierarchically structured Petri nets.
Similar articles
-
A structural analysis of the hypoxia response network.PeerJ. 2021 Apr 6;9:e10985. doi: 10.7717/peerj.10985. eCollection 2021. PeerJ. 2021. PMID: 33868803 Free PMC article.
-
The signaling petri net-based simulator: a non-parametric strategy for characterizing the dynamics of cell-specific signaling networks.PLoS Comput Biol. 2008 Feb 29;4(2):e1000005. doi: 10.1371/journal.pcbi.1000005. PLoS Comput Biol. 2008. PMID: 18463702 Free PMC article.
-
Exhaustive analysis of the modular structure of the spliceosomal assembly network: a Petri net approach.In Silico Biol. 2010;10(1):89-123. doi: 10.3233/ISB-2010-0419. In Silico Biol. 2010. PMID: 22430224
-
Exhaustive analysis of the modular structure of the spliceosomal assembly network: a petri net approach.Stud Health Technol Inform. 2011;162:244-78. Stud Health Technol Inform. 2011. PMID: 21685576
-
Network visualization and network analysis.EXS. 2007;97:245-75. doi: 10.1007/978-3-7643-7439-6_11. EXS. 2007. PMID: 17432271 Review.
Cited by
-
Role of compartmentalization on HiF-1α degradation dynamics during changing oxygen conditions: a computational approach.PLoS One. 2014 Oct 22;9(10):e110495. doi: 10.1371/journal.pone.0110495. eCollection 2014. PLoS One. 2014. PMID: 25338163 Free PMC article.
-
Petri nets and ODEs as complementary methods for comprehensive analysis on an example of the ATM-p53-NF-[Formula: see text]B signaling pathways.Sci Rep. 2022 Jan 21;12(1):1135. doi: 10.1038/s41598-022-04849-0. Sci Rep. 2022. PMID: 35064163 Free PMC article.
-
Identification and analysis of hub genes and networks related to hypoxia preconditioning in mice (No 035215).Oncotarget. 2017 Dec 21;9(15):11889-11904. doi: 10.18632/oncotarget.23555. eCollection 2018 Feb 23. Oncotarget. 2017. PMID: 29552280 Free PMC article.
-
A structural analysis of the hypoxia response network.PeerJ. 2021 Apr 6;9:e10985. doi: 10.7717/peerj.10985. eCollection 2021. PeerJ. 2021. PMID: 33868803 Free PMC article.
-
A unique transformation from ordinary differential equations to reaction networks.PLoS One. 2010 Dec 22;5(12):e14284. doi: 10.1371/journal.pone.0014284. PLoS One. 2010. PMID: 21203560 Free PMC article.
References
-
- Hartwell L, Hopfield J, Leibler S, Murray A. From molecular to modular cell biology. Nature. 1999;402:47–52. - PubMed
-
- Murata T. Petri nets: Properties, analysis and applications. Proceedings of the IEEE. 1989;77:541–580.
-
- Bause F, Kritzinger P. Stochastic Petri Nets. Vieweg; 2002.
-
- David R, Alla H. Discrete, Continuous, and Hybrid Petri Nets. Springer; 2005.
MeSH terms
LinkOut - more resources
Full Text Sources
