. 2010 Jan 19;5(1):e8760.
doi: 10.1371/journal.pone.0008760.

Genomic profiling of messenger RNAs and microRNAs reveals potential mechanisms of TWEAK-induced skeletal muscle wasting in mice

Affiliations

Genomic profiling of messenger RNAs and microRNAs reveals potential mechanisms of TWEAK-induced skeletal muscle wasting in mice

Siva K Panguluri et al. PLoS One. .

Abstract

Background: Skeletal muscle wasting is a devastating complication of several physiological and pathophysiological conditions. Inflammatory cytokines play an important role in the loss of skeletal muscle mass in various chronic diseases. We have recently reported that proinflammatory cytokine TWEAK is a major muscle-wasting cytokine. Emerging evidence suggests that gene expression is regulated not only at transcriptional level but also at post-transcriptional level through the expression of specific non-coding microRNAs (miRs) which can affect the stability and/or translation of target mRNA. However, the role of miRs in skeletal muscle wasting is unknown.

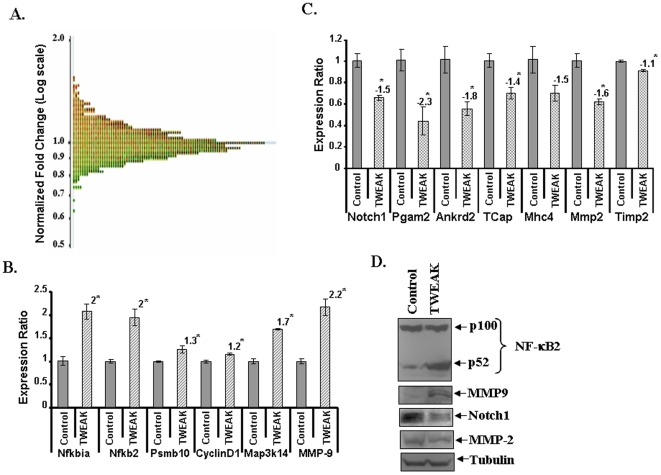
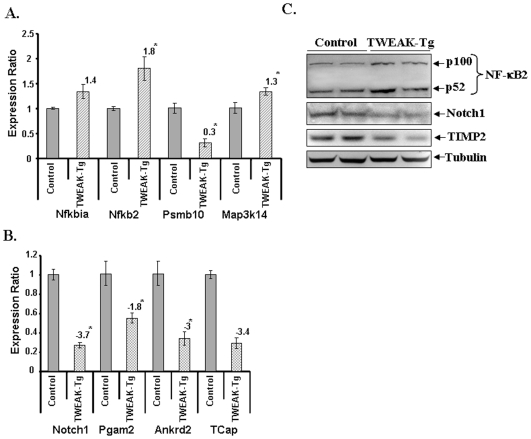
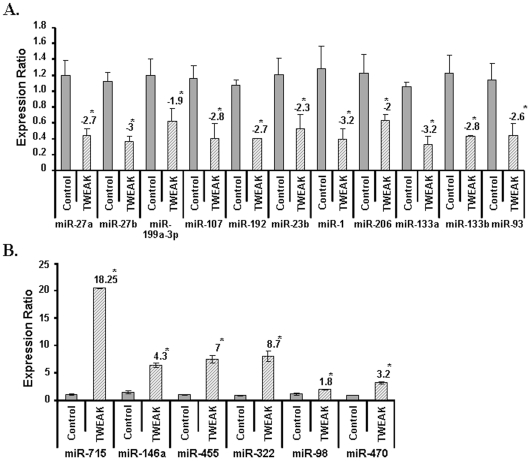
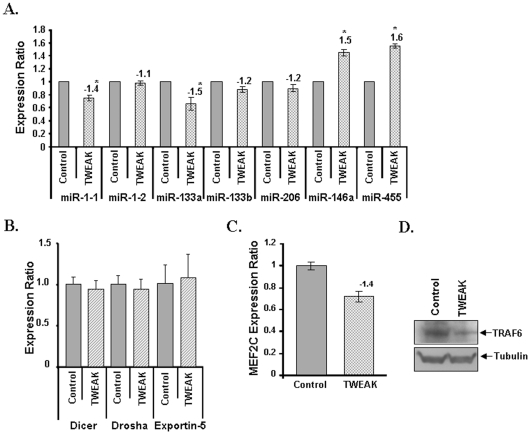
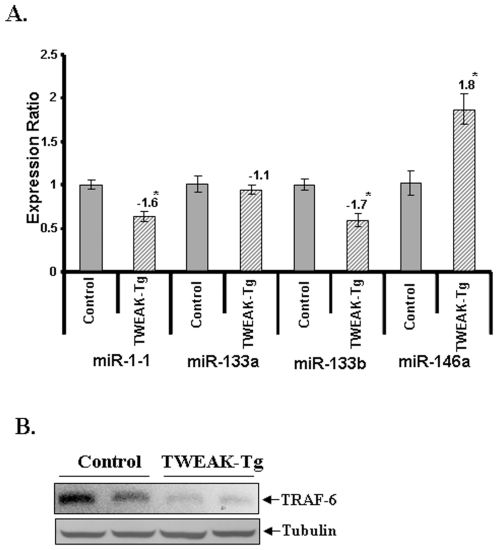
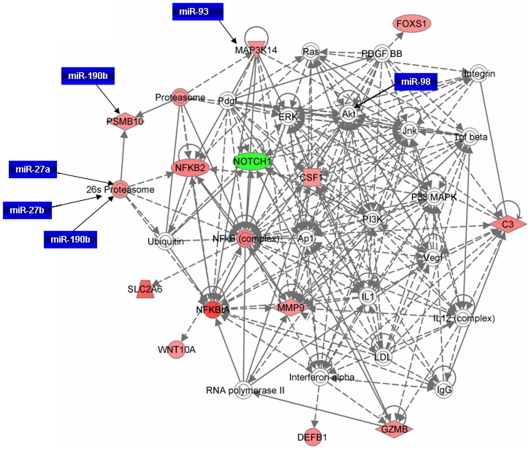
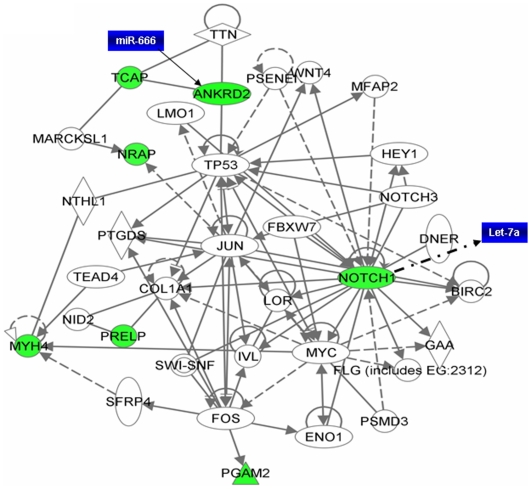
Methodology/principal findings: To understand the mechanism of action of TWEAK in skeletal muscle, we performed mRNA and miRs expression profile of control and TWEAK-treated myotubes. TWEAK increased the expression of a number of genes involved in inflammatory response and fibrosis and reduced the expression of few cytoskeletal gene (e.g. Myh4, Ankrd2, and TCap) and metabolic enzymes (e.g. Pgam2). Low density miR array demonstrated that TWEAK inhibits the expression of several miRs including muscle-specific miR-1-1, miR-1-2, miR-133a, miR-133b and miR-206. The expression of a few miRs including miR-146a and miR-455 was found to be significantly increased in response to TWEAK treatment. Ingenuity pathway analysis showed that several genes affected by TWEAK are known/putative targets of miRs. Our cDNA microarray data are consistent with miRs profiling. The levels of specific mRNAs and miRs were also found to be similarly regulated in atrophying skeletal muscle of transgenic mice (Tg) mice expressing TWEAK.

Conclusions/significance: Our results suggest that TWEAK affects the expression of several genes and microRNAs involved in inflammatory response, fibrosis, extracellular matrix remodeling, and proteolytic degradation which might be responsible for TWEAK-induced skeletal muscle loss.


Conflict of interest statement

Competing Interests: The authors have declared that no competing interests exist.

Figures

Figure 1
Figure 1. Differential expression of genes by TWEAK in C2C12 myotubes.
A). Distribution curve of differentially expressed genes in response to TWEAK treatment detected by cDNA microarray analysis. The normalized fold changes were plotted on y-axis on logarithmic scale. B & C). C2C12 myotubes were treated with 10 ng/ml of TWEAK for 18h followed by isolation of total RNA and QRT-PCR. Untreated cells under similar conditions were taken as control. The relative expression values from the QRT-PCR analysis were plotted for each gene are mean ± SD (n = 3). The numbers above the bar represents the fold changes with TWEAK treatment against control, and ‘*’ represents the statistical significance (p-value ≤0.01). Data presented here show that mRNA levels of Nfkbia, Nfkb2, cyclinD1, Map3k14, and Mmp9 was significantly increased whereas the levels of Notch1, Pgam2, Ankrd2, TCap, Mhc4, Mmp2, and Timp2 are reduced in TWEAK-treated C2C12 cells. The relative expression values from the QRT-PCR analysis were plotted for each gene are mean ± SD (n = 3). The numbers above the bar represents the fold changes with TWEAK treatment against control, and ‘*’ represents the statistical significance (p-value ≤0.01). D). Differential expression of NF-κB2, MMP-9, Notch1, and MMP-2. C2C12 myotubes were treated with 10 ng/ml of TWEAK for 18h following isolation of total protein for Western blotting. All the samples were quantified and equal amounts of proteins were loaded on 10% SDS-PAGE gel. Representative immunoblots from three independent experiments (n = 3) presented here showed that TWEAK treatment increases the protein levels of NF-κB2 and MMP-9 and reduces the levels of Notch1 and MMP-2.
Figure 2
Figure 2. Differential expression of genes in skeletal muscle of TWEAK-Tg mice.
Gastrocnemius muscle of 6 months old TWEAK-Tg mice and littermate control mice were used for total RNA isolation and QRT-PCR analysis. The relative expression values from the QRT-PCR analysis were plotted for each gene are mean ± SD (n = 3). The numbers above the bar represents the fold changes in TWEAK-Tg against littermate control mice, and ‘*’ represents the statistical significance (p-value ≤0.01). A) The levels of Nfkbia, Nfkb2, and Map3k14 were increased whereas the level of Psmb10 was found to be reduced in TWEAK-Tg mice compared to littermate control mice (n = 3 in each group). B). QRT-PCR analysis showed that the levels of Notch1, Pgam2, Ankrd1, and TCap were reduced in TWEAK-Tg mice compared to control mice (n = 3 in each group). C). Western blot analysis of NF-κB2, Notch1 and TIMP2 protein expression profiles in TWEAK-Tg compared to control mice. The gel pictures presented here from two independent experiments (n = 4) showed that protein levels of Notch1, and TIMP-2 were significantly reduced whereas NF-κB2 protein levels were increased in gastrocnemius muscle of TWEAK-Tg compared to littermate control.
Figure 3
Figure 3. Differential expression of miRNAs in TWEAK-treated C2C12 myotubes measured by low-density miRNA array.
A) C2C12 myotubes were treated with 10ng/ml of TWEAK for 18h following isolation of total RNA enriched with small RNAs. Untreated C2C12 myotubes under exactly similar conditions served as control. The normalized expression ratios were plotted for each miRNA are mean ± SD (n = 3). Low-density miRNA array of TWEAK-treated C2C12 myotubes showed down-regulation of miR-1, miR-133a, miR-133b, miR-206, miR-27, miR-23, miR-93, miR-199, miR-107, and miR-192. The numbers above the bar represents the fold changes with TWEAK treatment against control with p-values ≤0.05. B). TWEAK increased the expression of miR-715, miR-146a, miR-455, miR-322, mir-98, and miR-470 in C2C12 myotubes. The relative expression values from the QRT-PCR analysis were plotted for each gene are mean ± SD (n = 3). The values significantly different from corresponding untreated control (p-value ≤0.01) were represented with ‘*’.
Figure 4
Figure 4. Validation of differentially expressed miRs and their regulatory enzymes by QRT-PCR in TWEAK-treated C2C12 myoblasts.
A). TaqMan qRT-PCR analysis of miR-1-1, miR-1-2, miR-133a, miR-133b, miR-206, miR-146a, miR-206, miR146a, and miR-455 in TWEAK-treated C2C12 cells. The normalized expression ratios were plotted for each miRNA are mean ± SD (n = 3). The numbers above the bar represents the fold changes with TWEAK treatment against control ‘*’ represents the statistical significance (p-value ≤0.01). B). QRT-PCR analysis showed no significant difference in the expression ratio of Dicer, Dorsha and Exportin-5 between control (n = 3) and TWEAK-treated myotubes (n = 3). C). TWEAK-treatment significantly reduced the expression of MEF2C transcription factor. The relative expression values were plotted for MEF2C are mean ± SD (n = 3). D). C2C12 myotubes were treated with 10 ng/ml of TWEAK for 18h followed by isolation of total protein and performing Western blot. Equal amounts of proteins were loaded on 10% SDS-PAGE gel. Representative immunoblots from two independent experiments presented here showed that TWEAK significantly reduced the protein level of TRAF6 in C2C12 myotubes.
Figure 5
Figure 5. Expression profiles of select microRNAs and TRAF-6 proteins in skeletal muscle of TWEAK-Tg mice.
A) TaqMan QRT-PCR analysis of miR-1-1, miR-133a, miR-133b, and miR-146a in skeletal muscles of TWEAK-Tg mice. Gastrocnemius muscle from 6 months old TWEAK-Tg mice and littermate control mice were taken and total RNA enriched with small RNAs was isolated for TaqMan qRT-PCR analysis. The normalized expression ratios were plotted for each miRNA are mean ± SD (n = 3). ‘*’ represents the statistical significance (p-value ≤0.01). B). Gastrocnemius muscle of 6 months old TWEAK-Tg mice and littermate control mice were taken and total protein was isolated for Western blotting analysis. Representative immunoblot presented here show that the levels of TRAF-6 are considerably reduced in skeletal muscle of TWEAK-Tg (n = 4) mice compared to control (n = 4) mice. Equal amounts of protein loading were ensured by the expression levels of β-actin.
Figure 6
Figure 6. Network of genes up-regulated by TWEAK in microarray experiment.
NF-κB and proteasome pathways are major pathways affected by differentially regulated genes by TWEAK. Although many of the microRNAs differentially expressed by TWEAK may not be targeting the differentially regulated genes directly, they can regulate indirectly through other intermediary molecules. For example let-7a and miR-98 may have an indirect effect on expression of Nocth1 by regulating Akt pathway. The solid lines connecting molecules here represent a direct relation and dotted lines an indirect relation. The gene network presented here was adopted from Ingenuity pathway analysis tool with differentially regulated genes by TWEAK with p-values ≤0.05 and ≥1.5-fold. The genes shown in red are up-regulated in microarray data whereas down-regulated genes are shown in green color. Differentially expressed miRNAs (in blue colored boxes) having their putative targets are superimposed on the network.
Figure 7
Figure 7. Gene network of down-regulated genes by TWEAK and their possible regulatory miRNAs.
Notch1 signaling is major pathway down regulated by TWEAK in C2C12 myotubes. Genes represented in green boxes are those which were found to be significantly down-regulated in our microarray experiment. The genes shown without color are intermediate to the network and are not found in our microarray data. The solid lines connecting molecules here represents a direct relation and dotted lines an indirect relation. This network was obtained from IPA using differentially regulated genes by TWEAK with p-values ≤0.05 and ≥1.5-fold and was superimposed with the miRNAs (blue colored boxes) having their putative targets.

Similar articles

Cited by

References

    1. Li H, Malhotra S, Kumar A. Nuclear factor-kappa B signaling in skeletal muscle atrophy. J Mol Med. 2008;86:1113–1126. - PMC - PubMed
    1. Acharyya S, Guttridge DC. Cancer cachexia signaling pathways continue to emerge yet much still points to the proteasome. Clin Cancer Res. 2007;13:1356–1361. - PubMed
    1. Jackman RW, Kandarian SC. The molecular basis of skeletal muscle atrophy. Am J Physiol Cell Physiol. 2004;287:C834–843. - PubMed
    1. Spate U, Schulze PC. Proinflammatory cytokines and skeletal muscle. Curr Opin Clin Nutr Metab Care. 2004;7:265–269. - PubMed
    1. Tracey KJ, Cerami A. Tumor necrosis factor, other cytokines and disease. Annu Rev Cell Biol. 1993;9:317–343. - PubMed

Publication types