. 2010 Jan 19;5(1):e8768.
doi: 10.1371/journal.pone.0008768.

3'-end sequencing for expression quantification (3SEQ) from archival tumor samples

Affiliations

3'-end sequencing for expression quantification (3SEQ) from archival tumor samples

Andrew H Beck et al. PLoS One. .

Abstract

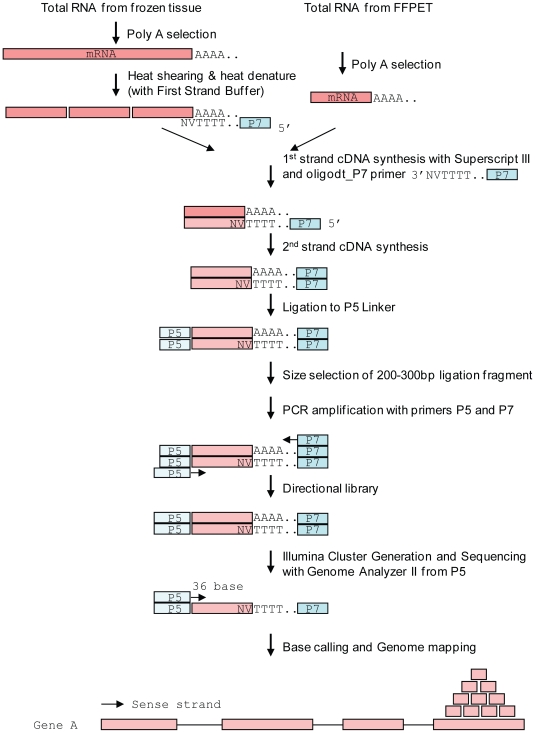
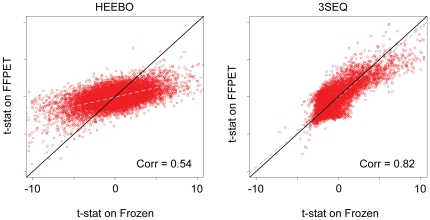
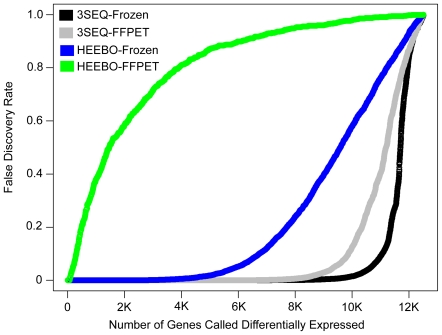
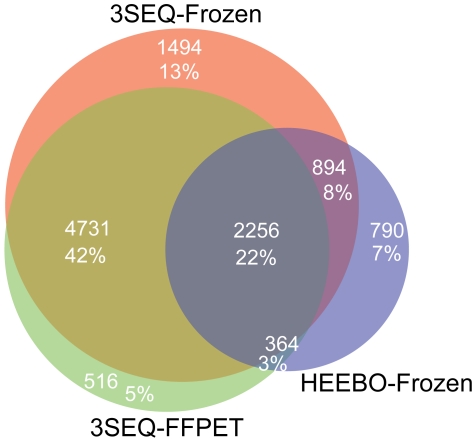
Gene expression microarrays are the most widely used technique for genome-wide expression profiling. However, microarrays do not perform well on formalin fixed paraffin embedded tissue (FFPET). Consequently, microarrays cannot be effectively utilized to perform gene expression profiling on the vast majority of archival tumor samples. To address this limitation of gene expression microarrays, we designed a novel procedure (3'-end sequencing for expression quantification (3SEQ)) for gene expression profiling from FFPET using next-generation sequencing. We performed gene expression profiling by 3SEQ and microarray on both frozen tissue and FFPET from two soft tissue tumors (desmoid type fibromatosis (DTF) and solitary fibrous tumor (SFT)) (total n = 23 samples, which were each profiled by at least one of the four platform-tissue preparation combinations). Analysis of 3SEQ data revealed many genes differentially expressed between the tumor types (FDR<0.01) on both the frozen tissue (approximately 9.6K genes) and FFPET (approximately 8.1K genes). Analysis of microarray data from frozen tissue revealed fewer differentially expressed genes (approximately 4.64K), and analysis of microarray data on FFPET revealed very few (69) differentially expressed genes. Functional gene set analysis of 3SEQ data from both frozen tissue and FFPET identified biological pathways known to be important in DTF and SFT pathogenesis and suggested several additional candidate oncogenic pathways in these tumors. These findings demonstrate that 3SEQ is an effective technique for gene expression profiling from archival tumor samples and may facilitate significant advances in translational cancer research.


Conflict of interest statement

Competing Interests: The authors have declared that no competing interests exist.

Figures

Figure 1
Figure 1. 3′-end Sequencing for Expression Quantification (3SEQ) schematic.
Either intact mRNA from frozen tissue or degraded mRNA from FFPET is enriched by poly-A selection. The mRNA from frozen tissue is then heat fragmented to approximately 100–200 bases. This heat fragmentation is incorporated with the RNA heat denature in the 1st strand cDNA synthesis by including the 1st strand cDNA buffer which contains Mg that is required for fragmentation. The short mRNA from FFPET is converted directly to cDNA without fragmentation. The 1st strand cDNA is synthesized with an oligo-dT_P7 RT primer that consists of three parts: 25-oligo-dT, P7 sequence linked to oligo-dT at the 5′ end and two degenerate nucleotides NV at the 3′ end. The single stranded cDNA is then converted to double stranded cDNA and the P5 linker is ligated to the end of the cDNA fragment opposite the P7 linker. The linker-ligated cDNA fragments of approximately 250 bp are selected and a PCR reaction is performed with primers that hybridize to the P5 and P7 linkers. The sequencing library is unidirectional and composed of cDNA, the P7 linker adjacent to the poly-A tail and the P5 linker on the opposite end of the fragment. The library is sequenced from the P5 end to generate 36 bp reads by a synthesis procedure using the Illumina Genome Analyzer. The first 25 bp of each read is used to map the reads to the genome. These reads are expected to be mapped towards to the 3′ UTR or the 3′ end of the 3′-most exon of expressed genes.
Figure 2
Figure 2. Scatter plot of modified t-statistics on FFPET vs. frozen tissue.
Each point is a gene plotted by the t-statistic generated on FFPET vs. the t-statistic generated on frozen tissue. The black line is a line with a slope of 1 and x intercept at 0, corresponding to perfect correlation between the axes. The grey dotted line is a plot of the first principal component. The left plot shows the HEEBO data, and the right plot shows the 3SEQ data.
Figure 3
Figure 3. False discovery rate vs. number of genes called significant.
The number of genes called differentially expressed between DTF and SFT is plotted along the x axis and the corresponding false discovery rate is plotted along the y axis. The 3SEQ-frozen analysis includes 5 DTF and 6 SFT; the 3SEQ-FFPET includes 6 DTF and 8 SFT; the HEEBO-frozen includes 9 DTF and 8 SFT; and the HEEBO-FFPET includes 6 DTF and 8 SFT.
Figure 4
Figure 4. Venn diagram of genes called significant in each platform-tissue type combination at an FDR<0.01.
The orange circle includes the set of genes identified as differentially expressed by 3SEQ-frozen, the green circle by 3SEQ-FFPET, and the lavender circle by HEEBO-frozen. Only 69 HEEBO-FFPET genes reached significance at this threshold, and the HEEBO-FFPET gene list was not plotted in the Venn diagram. The number of genes and percentage of total genes in each portion of the Venn diagram are labelled.
Figure 5
Figure 5. 3SEQ reads visualized on the UCSC Genome Browser.
The top portion of panels A and B show an ideogram of chromosome 20 with a vertical red bar at cytoband 20q13.33. A small portion of this cytoband is expanded and displays four custom tracks beneath it: DTF2435-FFPET, DTF2435-Frozen, SFT3524-FFPET, and SFT3524-Frozen. Each of these tracks displays the 3SEQ sequencing reads from a single DTF sample (DTF2435) and a single SFT sample (SFT3524), whose gene expression was measured from both FFPET and frozen tissue. Each track displays a red or blue block indicating a 3SEQ read that mapped to the displayed portion of the genome. The blocks are colored according to the read's directionality with reads aligned to the genome in the forward (left to right) direction in blue and reads aligned to the genome in the reverse orientation in red. In panel a, two adjacent genes are displayed on the bottom of the panel with the gene on the left (BIRC7) oriented 5′ to 3′ from left to right, and the gene on the right (NKAIN4/C20orf58) oriented 5′ to 3′ from the right to left. Panel a shows that NKAIN4 is expressed at a moderate level exclusively in DTF (both FFPET and frozen), while BIRC7 shows a total of 4 reads exclusively in the SFT sample (both FFPET and frozen) with no reads in the DTF sample. In this example, all reads mapped with the correct orientation to the 3′ portion of the transcript. Panel B shows a higher magnification display of a nearby region on 20q13.33. This genomic region encodes a transcript (AK025855/AK092092) that is expressed exclusively in SFT3524 (FFPET and Frozen) with no expression in DTF2435. Beneath the display of the piles of reads at the 3′ end of the transcript, a higher magnification view of the actual read sequences from a portion of the pile is displayed.

References

    1. Brown PO, Botstein D. Exploring the new world of the genome with DNA microarrays. Nat Genet. 1999;21:33–37. - PubMed
    1. Lipshutz RJ, Fodor SPA, Gingeras TR, Lockhart DJ. High density synthetic oligonucleotide arrays. Nature genetics. 1999;21:20–24. - PubMed
    1. Potti A, Dressman HK, Bild A, Riedel RF, Chan G, et al. Genomic signatures to guide the use of chemotherapeutics. Nat Med. 2006;12:1294–1300. - PubMed
    1. van de Vijver MJ, He YD, van't Veer LJ, Dai H, Hart AA, et al. A gene-expression signature as a predictor of survival in breast cancer. N Engl J Med. 2002;347:1999–2009. - PubMed
    1. Van't Veer LJ, Dai H, Van de Vijver MJ, He YD, Hart AA, et al. Gene expression profiling predicts clinical outcome of breast cancer. Nature. 415:530. - PubMed

Publication types