. 2010 Feb;233(1-3):23-33.
doi: 10.1007/s00232-009-9221-1. Epub 2010 Jan 23.

A single amino acid change in Ca(v)1.2 channels eliminates the permeation and gating differences between Ca(2+) and Ba(2+)

Affiliations

A single amino acid change in Ca(v)1.2 channels eliminates the permeation and gating differences between Ca(2+) and Ba(2+)

Zhe Li et al. J Membr Biol. 2010 Feb.

Abstract

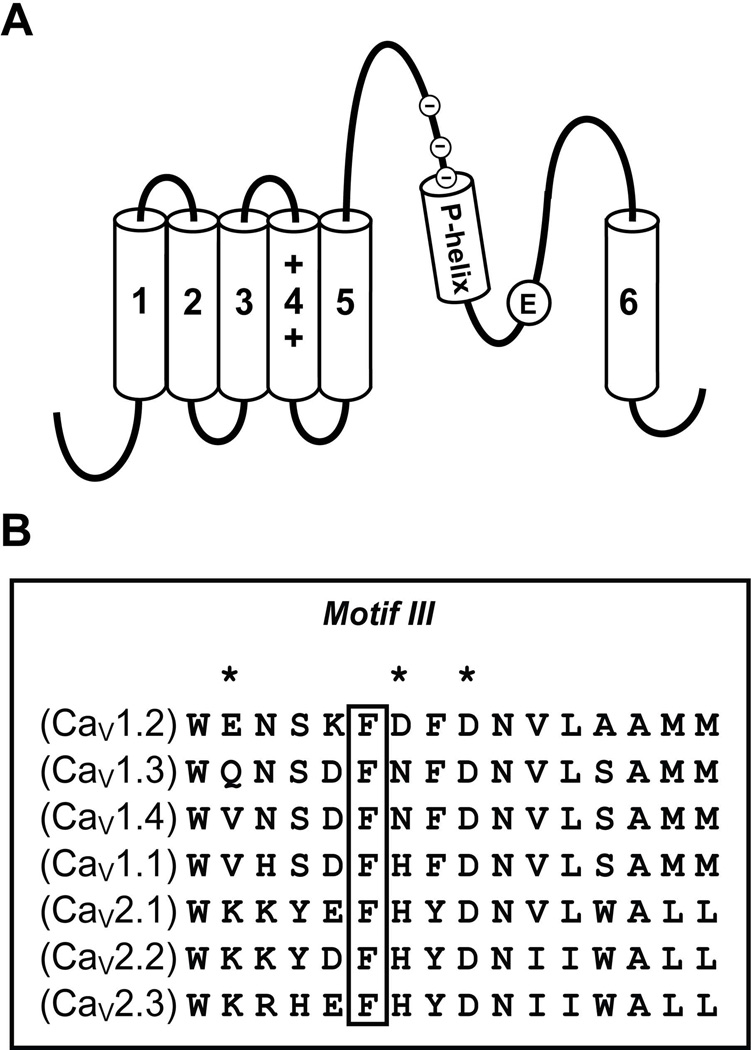
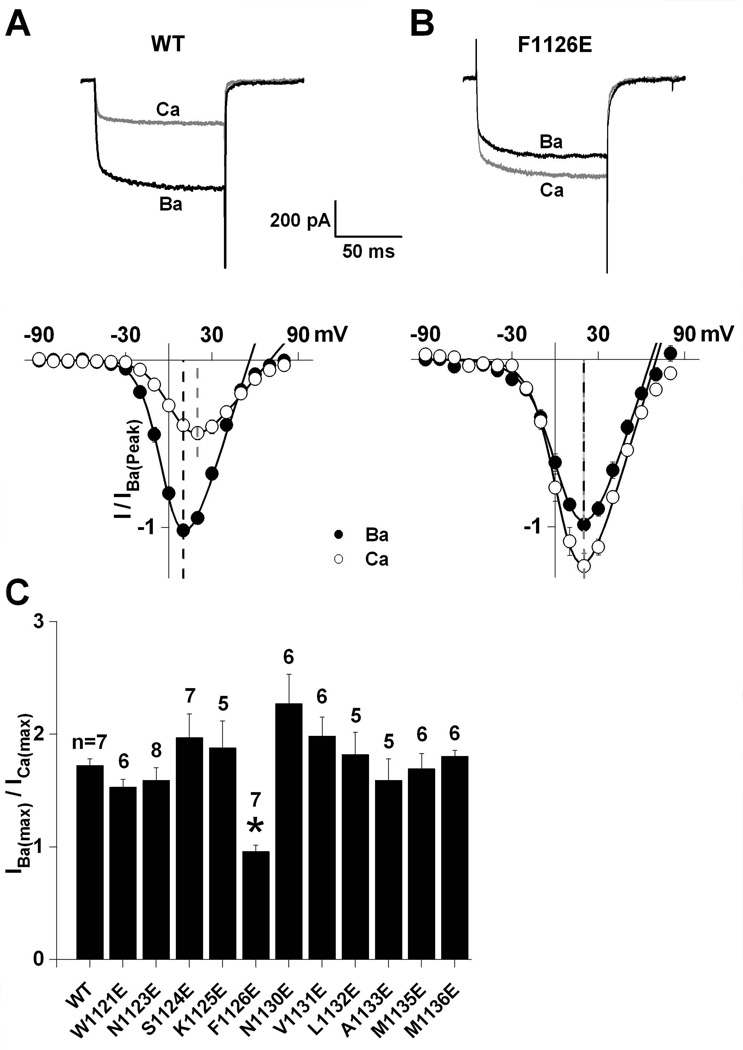
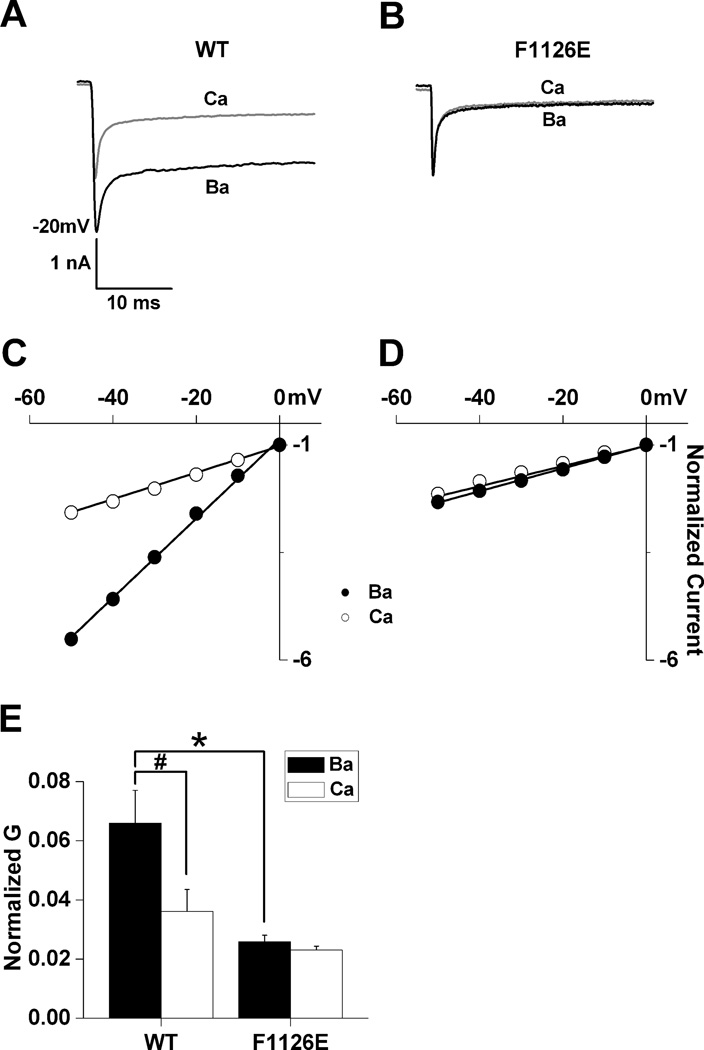
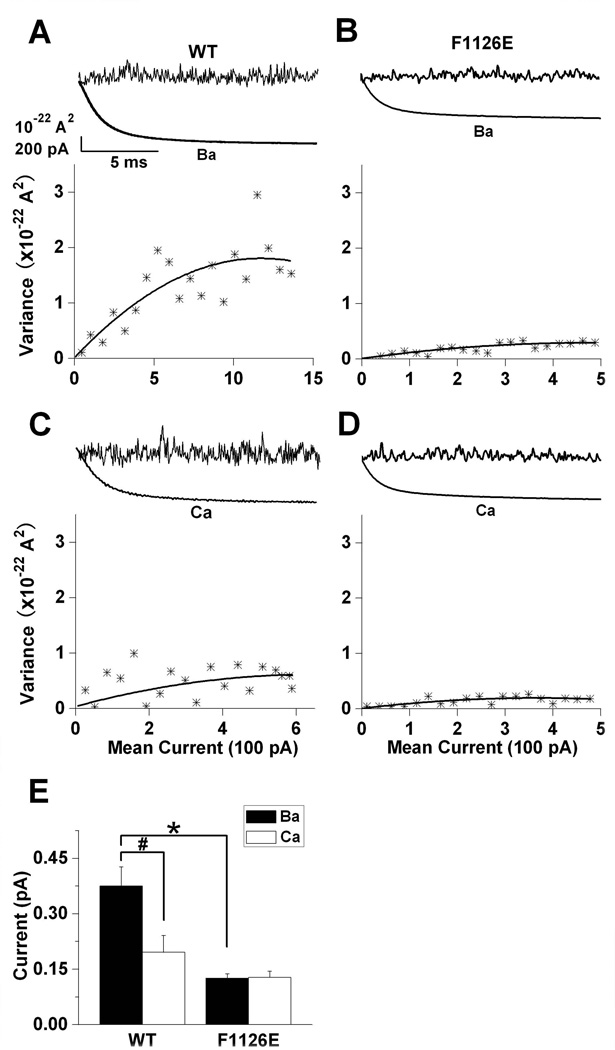
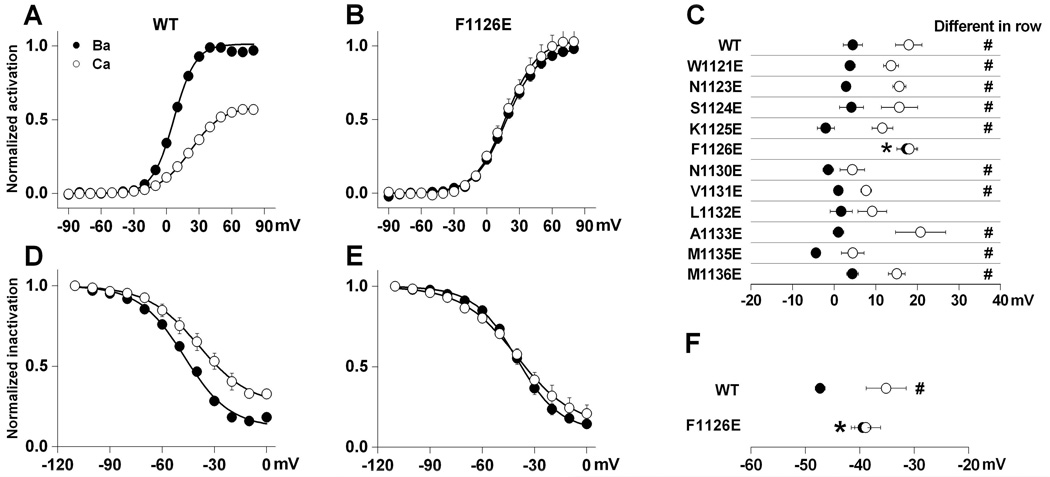
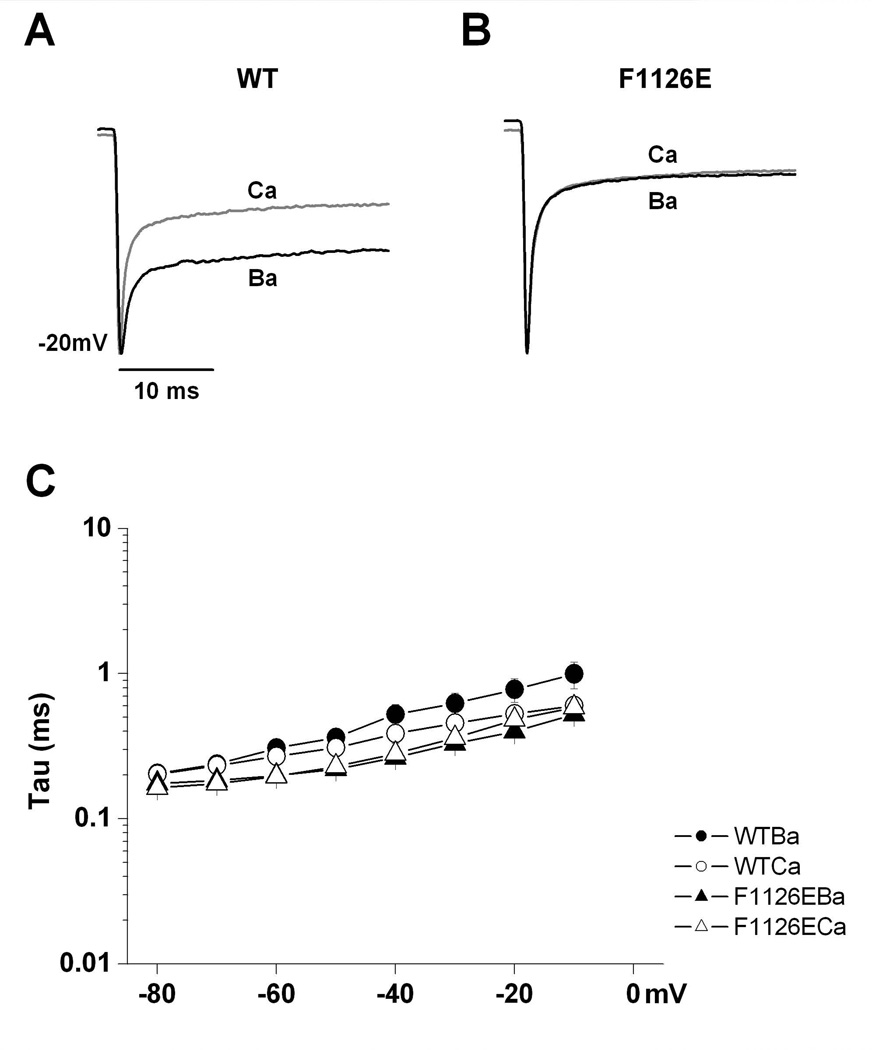
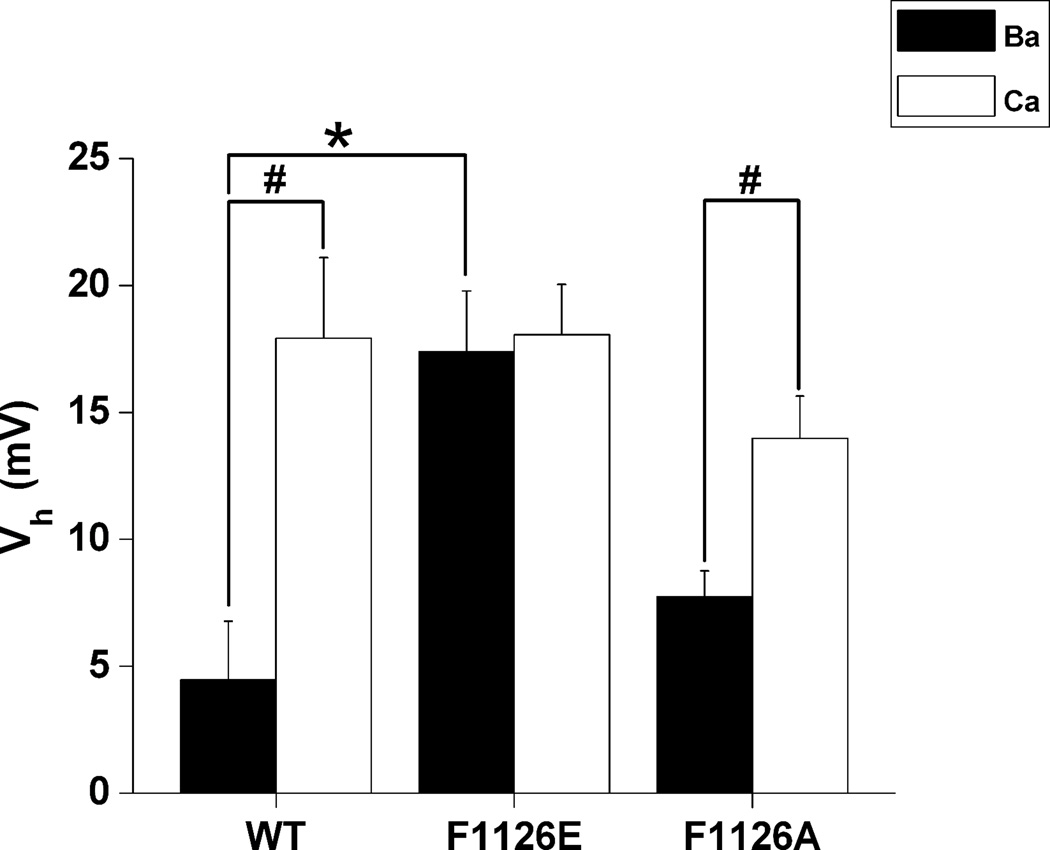
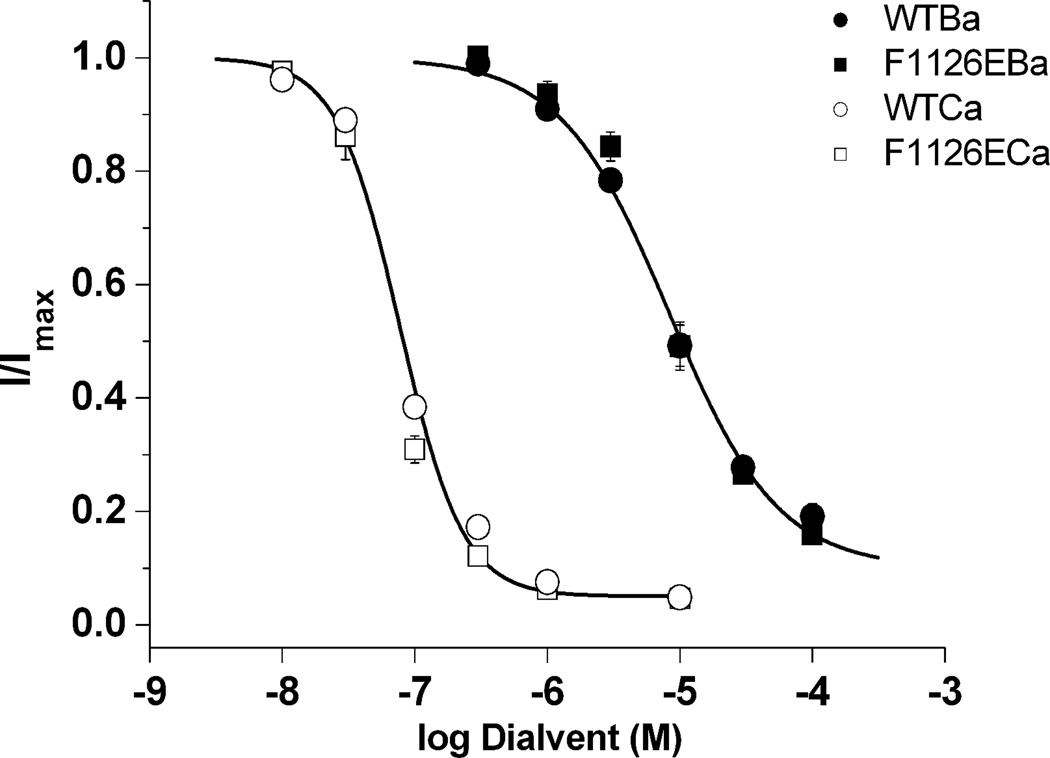
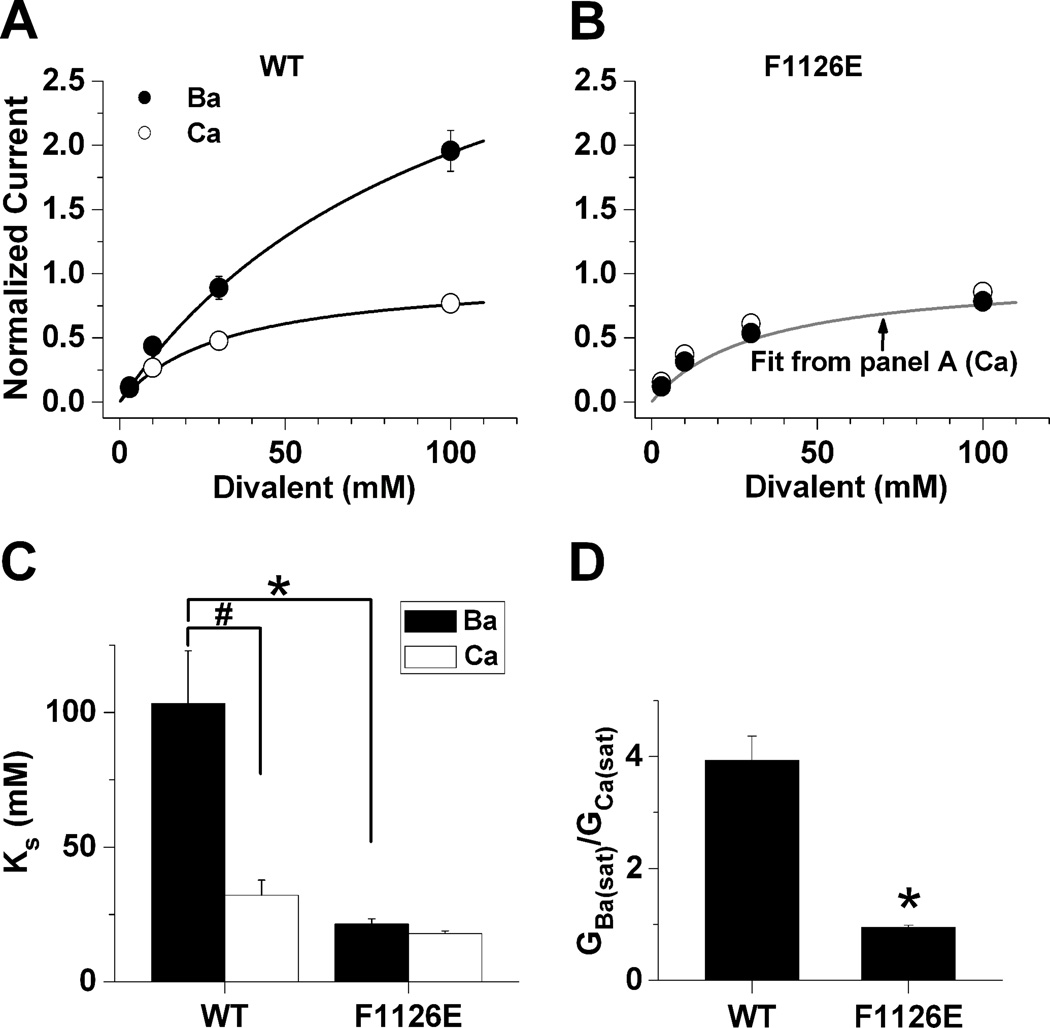
Glutamate scanning mutagenesis was used to assess the role of the calcicludine binding segment in regulating channel permeation and gating using both Ca(2+) and Ba(2+) as charge carriers. As expected, wild-type Ca(V)1.2 channels had a Ba(2+) conductance ~2x that in Ca(2+) (G(Ba)/G(Ca) = 2) and activation was ~10 mV more positive in Ca(2+) vs. Ba(2+). Of the 11 mutants tested, F1126E was the only one that showed unique permeation and gating properties compared to the wild type. F1126E equalized the Ca(V)1.2 channel conductance (G(Ba)/G(Ca) = 1) and activation voltage dependence between Ca(2+) and Ba(2+). Ba(2+) permeation was reduced because the interactions among multiple Ba(2+) ions and the pore were specifically altered for F1126E, which resulted in Ca(2+)-like ionic conductance and unitary current. However, the high-affinity block of monovalent cation flux was not altered for either Ca(2+) or Ba(2+). The half-activation voltage of F1126E in Ba(2+) was depolarized to match that in Ca(2+), which was unchanged from that in the wild type. As a result, the voltages for half-activation and half-inactivation of F1126E in Ba(2+) and Ca(2+) were similar to those of wild-type in Ca(2+). This effect was specific to F1126E since F1126A did not affect the half-activation voltage in either Ca(2+) or Ba(2+). These results indicate that residues in the outer vestibule of the Ca(V)1.2 channel pore are major determinants of channel gating, selectivity, and permeation.


Figures

Fig. 1
Fig. 1. The calcicludine binding region is highly conserved amongst voltage-gated calcium channel family members
(A) The membrane topology of the α1 subunit consists of four homologous repeats (repeat III is shown), each consisting of six transmembrane segments (S1–S6). The selectivity filter is formed by four conserved glutamate residues (E), each residing on one of the four S5–S6 connecting loops. The intracellular portions of all four S6 transmembrane segments form the inner lining of the permeation pathway and the activation gate. The S4 segment from each repeat is an amphipathic helix consisting of several positively charged lysine or arginine residues and functions as the voltage sensor that couples membrane depolarization to channel activation. Upstream of the pore-glutamate is the putative pore-helix (P-helix), which is juxtaposed to Phe-1126 and the calcicludine binding site residues (circled minus signs). (B) Amino acid alignment (residues 1121 to 1136) of the calcicludine binding region. Phe-1126 is indicated with a box and Glu-1122, Asp-1127 and Asp-1129 are indicated with asterisks (*).
Fig. 2
Fig. 2. Substitution of glutamate for Phe-1126 selectively alters L-channel permeation properties in Ba2+
Wild-type (A) and F1126E (B) currents were evoked by 100 msec step depolarizations to +20 mV from a holding potential of −90 mV in 30 mM Ba2+ and Ca2+. I–V relationships were normalized to peak Ba2+ currents recorded from the same cell. Dashed lines indicate peak current voltages for Ba2+ (black) and Ca2+ (gray). (C) Peak tail-currents were measured at −50 mV following 100 msec depolarizing steps ranging from −90 to +80 mV in 30 mM Ba2+ and Ca2+. Data were fit with a Boltzmann equation through the activation vs. voltage data and normalized to maximal Ba2+ currents (IBa(max)). IBa(max)/ICa(max) are plotted for wild-type and all the mutant channels tested. Of the all the mutants investigated in this study, only F1126E was significantly different from wild-type (*).
Fig. 3
Fig. 3. F1126E conducts Ba2+ ions as if they were Ca2+
Whole-cell conductance is a product of the single channel current amplitude, the open probability (Po) and the number of active channels. Peak tail-currents were measured from −80 to +20 mV following 50 msec depolarizing steps to +50 mV which were used to maximally activate wild-type (A) and F1126E (B) in 10 mM Ba2+ and Ca2+ from the same cell, thus minimizing differences in Po that could arise from shifts in the voltage-dependence of activation. Linear portions of the current-voltage relationships (−50 to 0 mV) were normalized to amplitudes measured at 0 mV for wild-type (C) and F1126E (D). Normalized data were fit with the equation Itail = G × (V − Erev), where Itail is the peak tail current, Erev the reversal potential and G the maximal slope conductance. (E) Normalized slope conductances are plotted for wild-type (n = 8) and F1126E (n = 5).
Fig. 4
Fig. 4. F1126E reduces the unitary current amplitude in Ba2+ to match that in Ca2+
Ba2+ (A and B) and Ca2+ (C and D) currents for wild-type and F1126E were evoked by a series of 100 voltage steps (15 msec) to 0 mV from a holding potential of −120 mV. Data were analyzed using PULSETOOLS nonstationary noise analysis software to acquire the variance and mean current of each cell (A–D, upper traces). Variance-mean current relationships (A–D, lower graphs) were fit with the equation σ2 = i × I − I2/N − σb2, where σ2 is the variance, σb2 the baseline variance or background noise, i the unitary current amplitude, I the mean current and N the number of active channels: wild-type (Ba2+), i = 0.290 ± 0.019 pA, Po = 53.8 ± 6.1%, n = 7; wild-type (Ca2+), i = 0.159 ± 0.033 pA, Po = 48.4 ± 11.6%, n = 7; F1126E (Ba2+), i = 0.126 ± 0.012 pA, Po = 42.8 ± 11.6%, n = 6; F1126E (Ca2+), i = 0.128 ± 0.017 pA, Po = 66.9 ± 9.6%, n = 7. (E) Mean unitary current amplitudes are plotted for wild-type and F1126E.
Fig. 5
Fig. 5. Replacing Phe-1126 with glutamate selectively alters L-channel gating in Ba2+
Peak tail-currents were measured at −50 mV following 100 msec depolarizing steps ranging from −90 to +80 mV in 30 mM Ba2+ and Ca2+ for wild-type (A) and F1126E (B). Tail current amplitudes recorded in Ba2+ and Ca2+ were normalized to IBa(max). Boltzmann fits were used to obtain half activation voltages (Vh) and slope factors (k) (mV): wild-type (Ba2+), Vh = 4.5 ± 2.3, k = 9.6 ± 1.2; wild-type (Ca2+) Vh = 17.9 ± 3.2, k = 14.8 ± 0.8 (n = 7); F1126E (Ba2+) Vh = 17.4 ± 2.4, k = 14.6 ± 2.1; F1126E (Ca2+) Vh = 18.1 ± 2.0, k = 15.3 ± 1.0 (n = 7); (C) Mean Vh values derived from Boltzmann fits are plotted for wild-type and each mutant tested. The number of cells for each group is the same as that for Fig. 2C. (D, E) Steady-state inactivation was measured as a ratio of current elicited by 50 msec prepulses and postpulses to 0 mV (Post/Pre ratio) separated by 10 sec conditioning pulses ranging from −110 to 0 mV in 10 mM Ba2+ and Ca2+ for wild-type (D) and F1126E (E). Results from Boltzmann fits are as follows (mV): wild-type (Ba2+), Vh = −47.3 ± 0.9, k = 13.1 ± 0.2, n = 7; wild-type (Ca2+) Vh = −35.2 ± 3.7, k = 13.7 ± 0.5, n = 6; F1126E (Ba2+) Vh = −39.5 ± 1.5, k = 12.7 ± 1.3, n = 6; F1126E (Ca2+) Vh = −38.9 ± 2.7, k = 16.3 ± 1.3, n = 7. (F) Mean Vh values for steady-state inactivation are plotted for wild-type and F1126E. Significant difference in Vh between Ca+2 vs. Ba2+ (in row) is indicated by #, while * indicated significant difference between mutant and wild-type (in column) in Ba2+.
Fig. 6
Fig. 6. F1126E does not affect deactivation time constants of the channel
Sample wild-type (A) and E1126E (B) tail currents were measured in 10 mM Ba2+ and 10 mM Ca2+ as indicated. Tail currents were elicited by repolarizing steps to −20 mV following 50 msec steps to +50 mV. Tail currents measured in Ca2+ were normalized to those measured in Ba2+ from the same cell. (C) To quantify deactivation time constants (τ) at the indicated voltages, raw data were fitted with a single exponential equation. Average τ at the indicated repolarization potentials are shown for wild-type (n = 8) and F1126E (n = 5) in Ba2+ and Ca2+.
Fig. 7
Fig. 7. Replacing Phe-1126 with alanine does not affect L-channel Vh
Half activation voltage (Vh) is plotted for wild-type, F1126E and F1126A channels with Ba2+ and Ca2+ as the ion carriers. F1126A (Ba2+) Vh = 7.7 ± 1.0 mV, (Ca2+) Vh = 14.0 ± 1.7 mV, n = 6. See Fig. 5 for more details.
Fig. 8
Fig. 8. High affinity binding of single Ba2+ and Ca2+ ions to the selectivity filter is not altered by the F1126E mutation
Tail-currents were evoked at −50 mV following 20 msec depolarizing steps to +30 mV to maximally activate wild-type and F1126E channels. Peak tail-currents measured at the indicated concentrations of free Ba2+ and Ca2+ were normalized to the maximum current amplitude determined from the Hill equation fit to the dose-response data from each cell. IC50 values determined in Ca2+ (nM): wild-type, 80.0 ± 3.7 (n = 6); F1126E, 67.0 ± 5.6 (n = 5); in Ba2+ (µM): wild-type, 9.3 ± 1.0 (n = 5); F1126E, 10.5 ± 1.2 (n = 6).
Fig. 9
Fig. 9. F1126E alters the relationship between saturating and conductance of Ba2+
Peak tail-currents were recorded at 0 mV following 20 msec depolarizing steps to +70 mV, to maximally activate wild-type (A) or F1126E (B) in Ba2+ and Ca2+. Tail-currents were measured in 3, 10, 30 and 100 mM Ba2+ and Ca2+ from the same cell. Data were normalized to GCa(sat) and fit by the Michaelis-Menton equation, G = Gsat/(1 + (KS/c)), where Gsat is the level of current at saturating concentrations of divalent cations, c is the concentration of divalent cation, and KS is the divalent cation concentration that produces one-half Gsat. The fit for wild-type (Ca2+) is shown in panel B (gray). GBa(sat) (nS), wild-type, 9.2 ± 2.9 (n = 5); F1126E, 3.6 ± 0.7 (n = 6); GCa(sat): wild-type, 2.7 ± 1.3; F1126E, 3.7 ± 0.6. (C) KS values in mM are plotted for wild-type and F1126E in Ba2+ and Ca2+. (D) Data are plotted as GBa(sat)/GCa(sat) for wild-type and F1126E.

Similar articles

Cited by

References

    1. Babich O, Matveev V, Harris AL, et al. Ca2+-dependent inactivation of Ca(V)1.2 channels prevents Gd3+ block: Does Ca2+ block the pore of inactivated channels? J Gen Physiol. 2007;129:477–483. - PMC - PubMed
    1. Bean BP. Two kinds of calcium channels in canine atrial cells. Differences in kinetics, selectivity and pharmacology. J Gen Physiol. 1985;86:1–30. - PMC - PubMed
    1. Byerly L, Chase PB, Stimers JR. Permeation and interaction of divalent cations in calcium channels of snail neurons. J Gen Physiol. 1985;85:491–518. - PMC - PubMed
    1. Catterall WA, Perez-Reyes E, Snutch TP, Striessnig J. International Union of Pharmacology. XLVIII. Nomenclature and structure-function relationships of voltage-gated calcium channels. Pharmacol Rev. 2005;57:411–425. - PubMed
    1. Cens T, Rousset M, Kajava A, et al. Molecular determinant for specific Ca/Ba selectivity profiles of low and high threshold Ca2+ channels. J Gen Physiol. 2007;130:415–425. - PMC - PubMed

Publication types