

Cell-based multiscale computational modeling of small molecule absorption and retention in the lungs
- PMID: 20099073
- PMCID: PMC2907074
- DOI: 10.1007/s11095-009-0034-9
Cell-based multiscale computational modeling of small molecule absorption and retention in the lungs
Abstract
Purpose: For optimizing the local, pulmonary targeting of inhaled medications, it is important to analyze the relationship between the physicochemical properties of small molecules and their absorption, retention and distribution in the various cell types of the airways and alveoli.
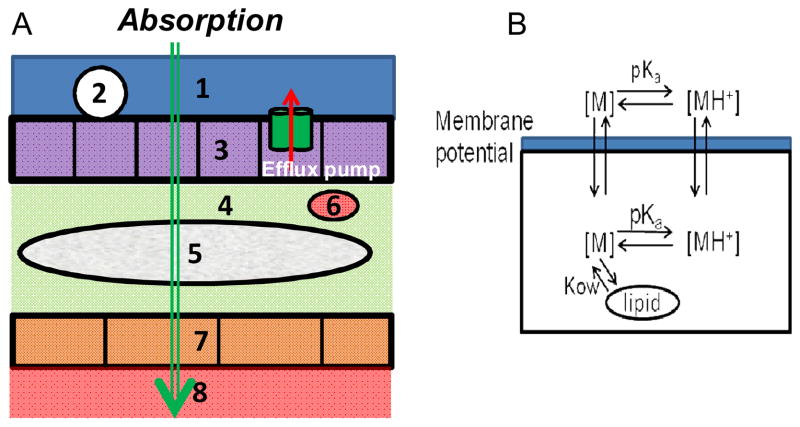
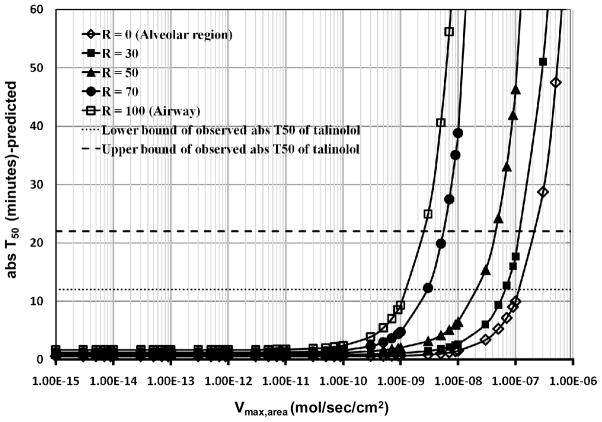
Methods: A computational, multiscale, cell-based model was constructed to facilitate analysis of pulmonary drug transport and distribution. The relationship between the physicochemical properties and pharmacokinetic profile of monobasic molecules was explored. Experimental absorption data of compounds with diverse structures were used to validate this model. Simulations were performed to evaluate the effect of active transport and organelle sequestration on the absorption kinetics of compounds.
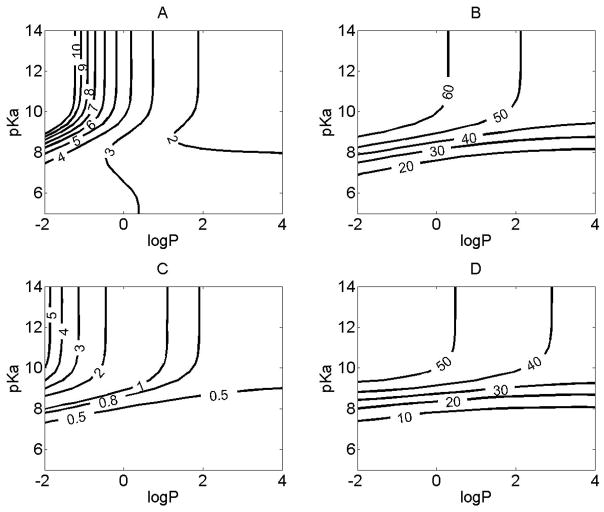
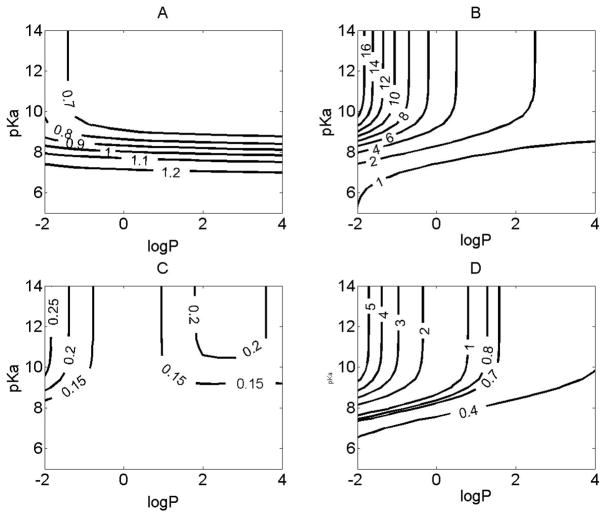
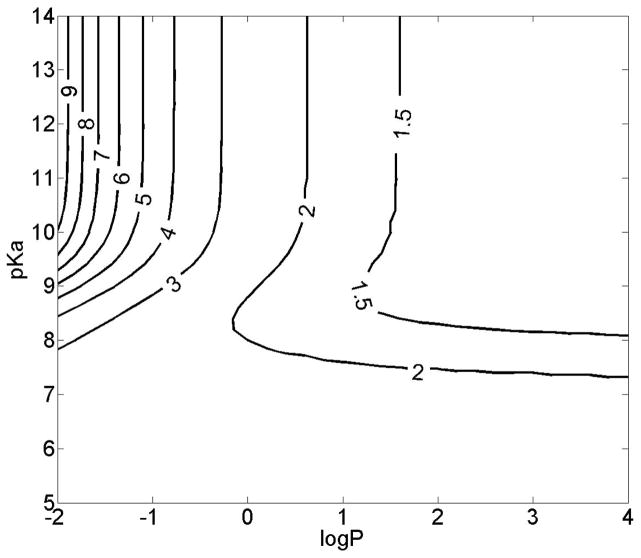
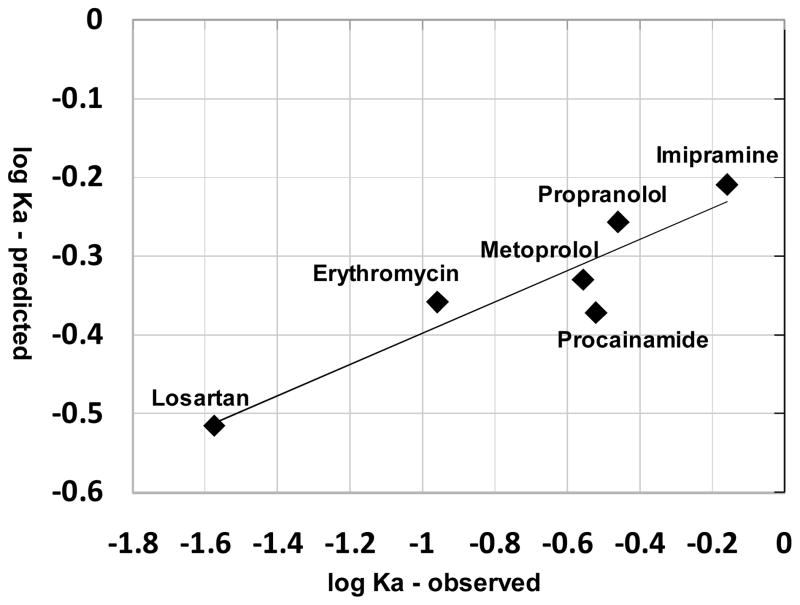
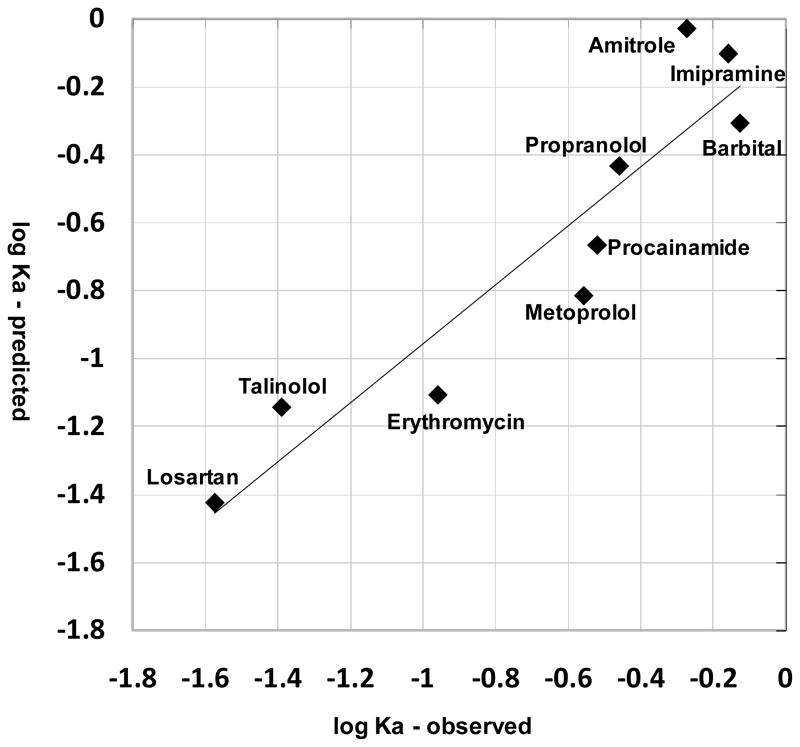
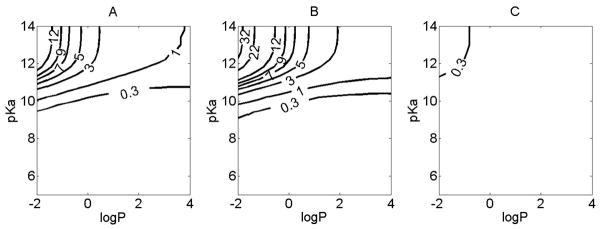
Results: Relating the physicochemical properties to the pharmacokinetic profiles of small molecules reveals how the absorption half-life and distribution of compounds are expected to vary in different cell types and anatomical regions of the lung. Based on logP, pK(a) and molecular radius, the absorption rate constants (K(a)) calculated with the model were consistent with experimental measurements of pulmonary drug absorption.
Conclusions: The cell-based mechanistic model developed herein is an important step towards the rational design of local, lung-targeted medications, facilitating the design and interpretation of experiments aimed at optimizing drug transport properties in lung.
Figures
Similar articles
-
Pulmonary absorption - estimation of effective pulmonary permeability and tissue retention of ten drugs using an ex vivo rat model and computational analysis.Eur J Pharm Biopharm. 2018 Mar;124:1-12. doi: 10.1016/j.ejpb.2017.11.013. Epub 2017 Nov 27. Eur J Pharm Biopharm. 2018. PMID: 29191716
-
In silico predictions of gastrointestinal drug absorption in pharmaceutical product development: application of the mechanistic absorption model GI-Sim.Eur J Pharm Sci. 2013 Jul 16;49(4):679-98. doi: 10.1016/j.ejps.2013.05.019. Epub 2013 May 29. Eur J Pharm Sci. 2013. PMID: 23727464
-
Pulmonary absorption rate and bioavailability of drugs in vivo in rats: structure-absorption relationships and physicochemical profiling of inhaled drugs.J Pharm Sci. 2003 Jun;92(6):1216-33. doi: 10.1002/jps.10386. J Pharm Sci. 2003. PMID: 12761811
-
Physicochemical profiling (solubility, permeability and charge state).Curr Top Med Chem. 2001 Sep;1(4):277-351. doi: 10.2174/1568026013395100. Curr Top Med Chem. 2001. PMID: 11899112 Review.
-
The subcellular distribution of small molecules: from pharmacokinetics to synthetic biology.Mol Pharm. 2011 Oct 3;8(5):1619-28. doi: 10.1021/mp200092v. Epub 2011 Aug 15. Mol Pharm. 2011. PMID: 21805990 Free PMC article. Review.
Cited by
-
Characterization of rhodamine-123 as a tracer dye for use in in vitro drug transport assays.PLoS One. 2012;7(3):e33253. doi: 10.1371/journal.pone.0033253. Epub 2012 Mar 28. PLoS One. 2012. PMID: 22470447 Free PMC article.
-
A cell-based computational modeling approach for developing site-directed molecular probes.PLoS Comput Biol. 2012;8(2):e1002378. doi: 10.1371/journal.pcbi.1002378. Epub 2012 Feb 23. PLoS Comput Biol. 2012. PMID: 22383866 Free PMC article.
-
Spatio-temporal simulation of first pass drug perfusion in the liver.PLoS Comput Biol. 2014 Mar 13;10(3):e1003499. doi: 10.1371/journal.pcbi.1003499. eCollection 2014 Mar. PLoS Comput Biol. 2014. PMID: 24625393 Free PMC article.
-
Predicting Regional Respiratory Tissue and Systemic Concentrations of Orally Inhaled Drugs through a Novel PBPK Model.Drug Metab Dispos. 2022 May;50(5):519-528. doi: 10.1124/dmd.121.000789. Epub 2022 Mar 4. Drug Metab Dispos. 2022. PMID: 35246463 Free PMC article.
-
A compartment-quasi-3D multiscale approach for drug absorption, transport, and retention in the human lungs.Int J Numer Method Biomed Eng. 2018 May;34(5):e2955. doi: 10.1002/cnm.2955. Epub 2018 Jan 25. Int J Numer Method Biomed Eng. 2018. PMID: 29272565 Free PMC article.
References
-
- Brewis RL, Corrin B, Geddes DM, Gibson GJ, editors. Respiratory Medicine. WB Saunders Company Ltd; London: 1995.
-
- Ehrhardt C, Kim K-J, editors. Drug absorption studies: in situ, in vitro and in silico models. Springer; Arlington, VA: 2008.
-
- Wall DA, Lanutti AT. High-Levels of Exopeptidase Activity Are Present in Rat and Canine Bronchoalveolar Lavage Fluid. Int J Pharm. 1993;97:171–181.
-
- Patton JS. Mechanisms of macromolecule absorption by the lungs. Adv Drug Deliver Rev. 1996;19:3–36.
Publication types
MeSH terms
Substances
Grants and funding
LinkOut - more resources
Full Text Sources
Medical
