. 2010 May;77(5):410-9.
doi: 10.1002/cyto.a.20859.

Evaluation of a 12-color flow cytometry panel to study lymphocyte, monocyte, and dendritic cell subsets in humans

Affiliations

Evaluation of a 12-color flow cytometry panel to study lymphocyte, monocyte, and dendritic cell subsets in humans

Patrick Autissier et al. Cytometry A. 2010 May.

Abstract

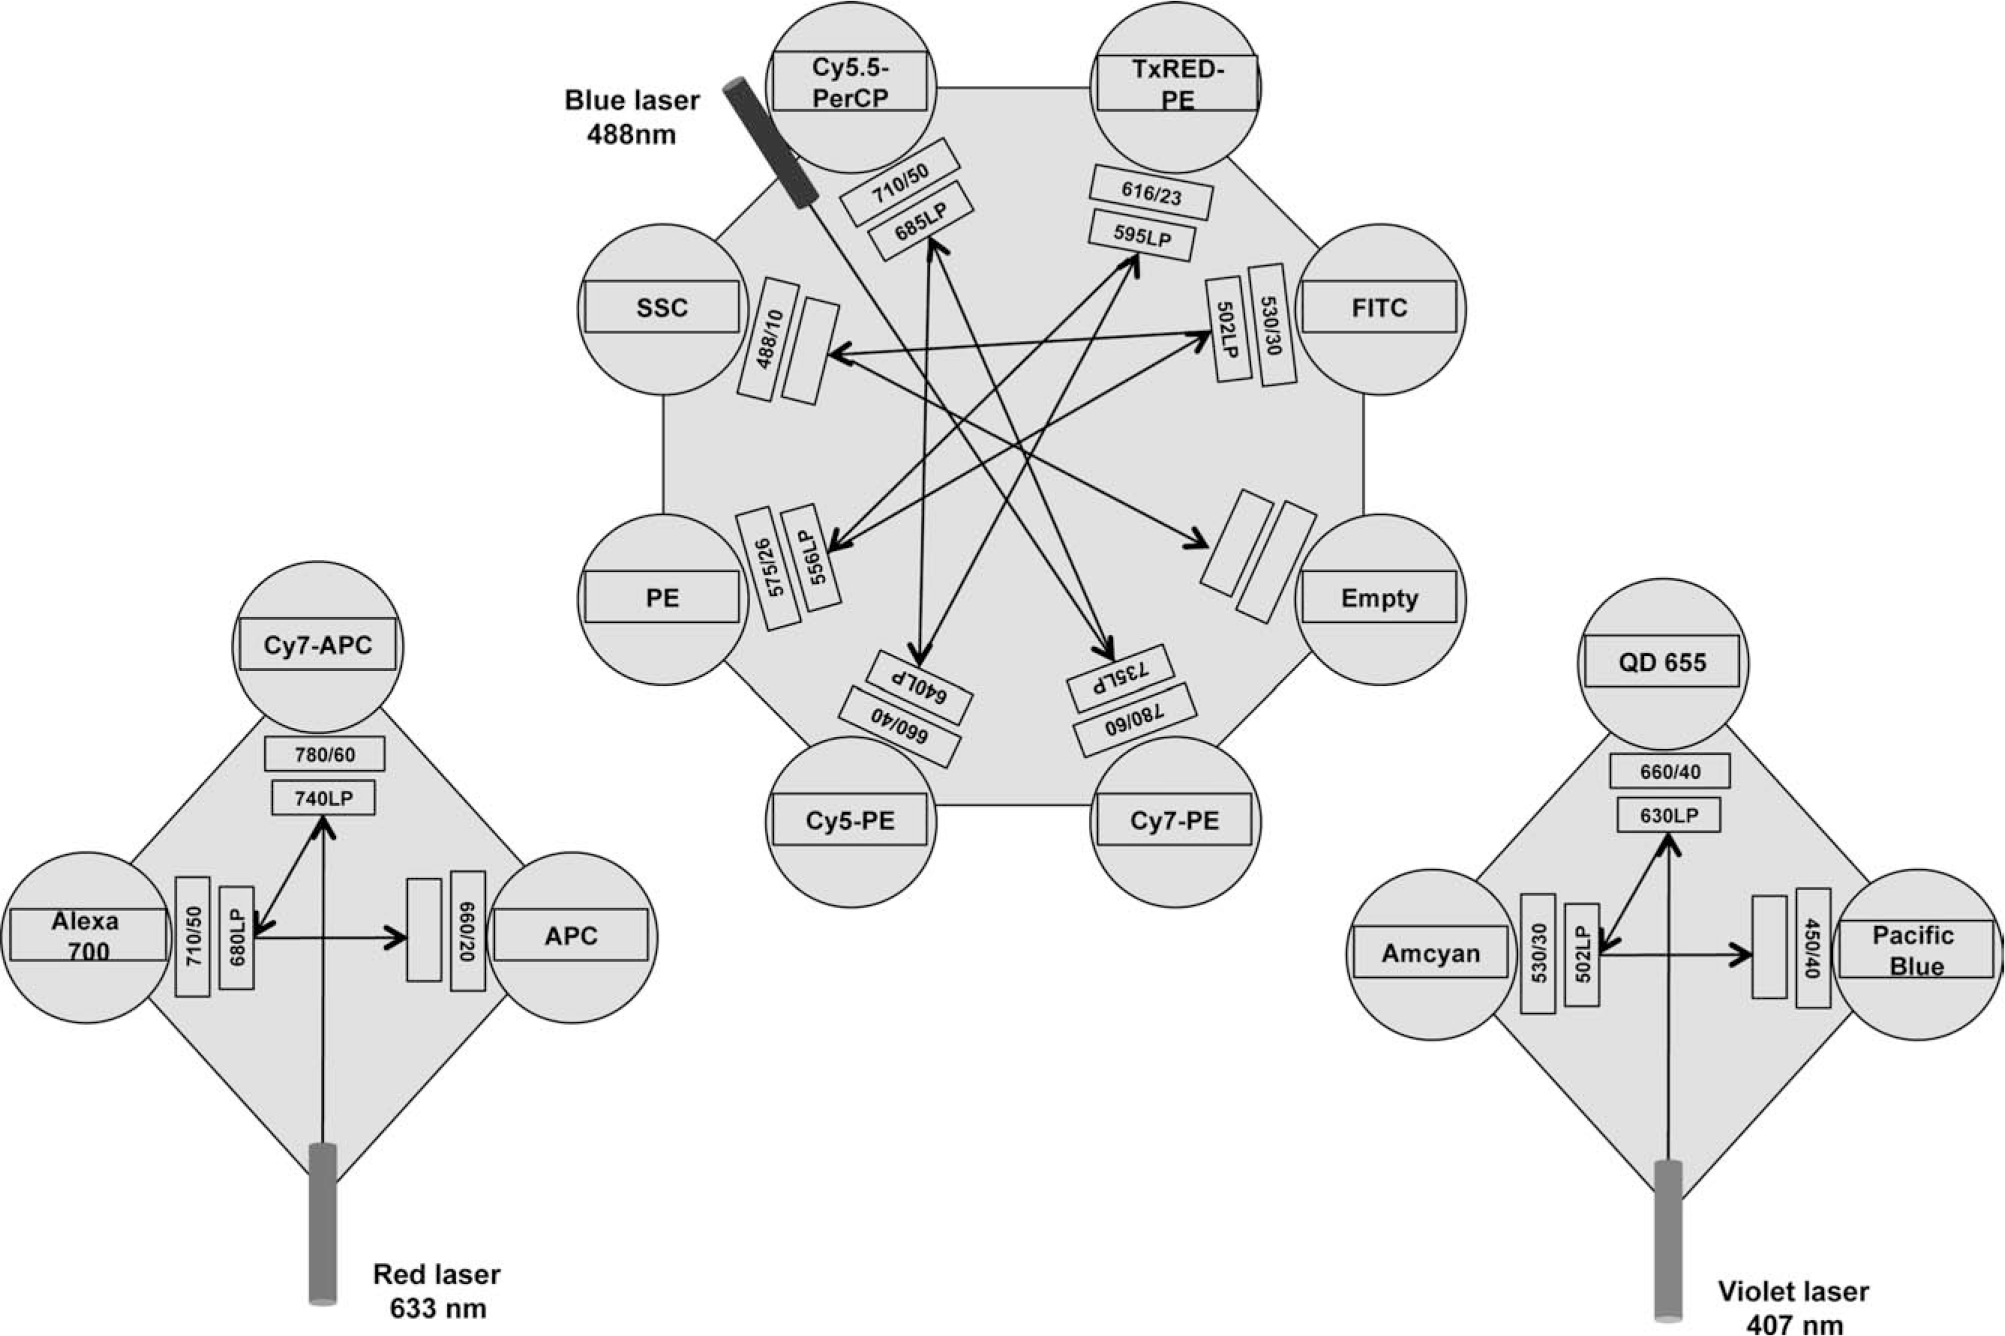
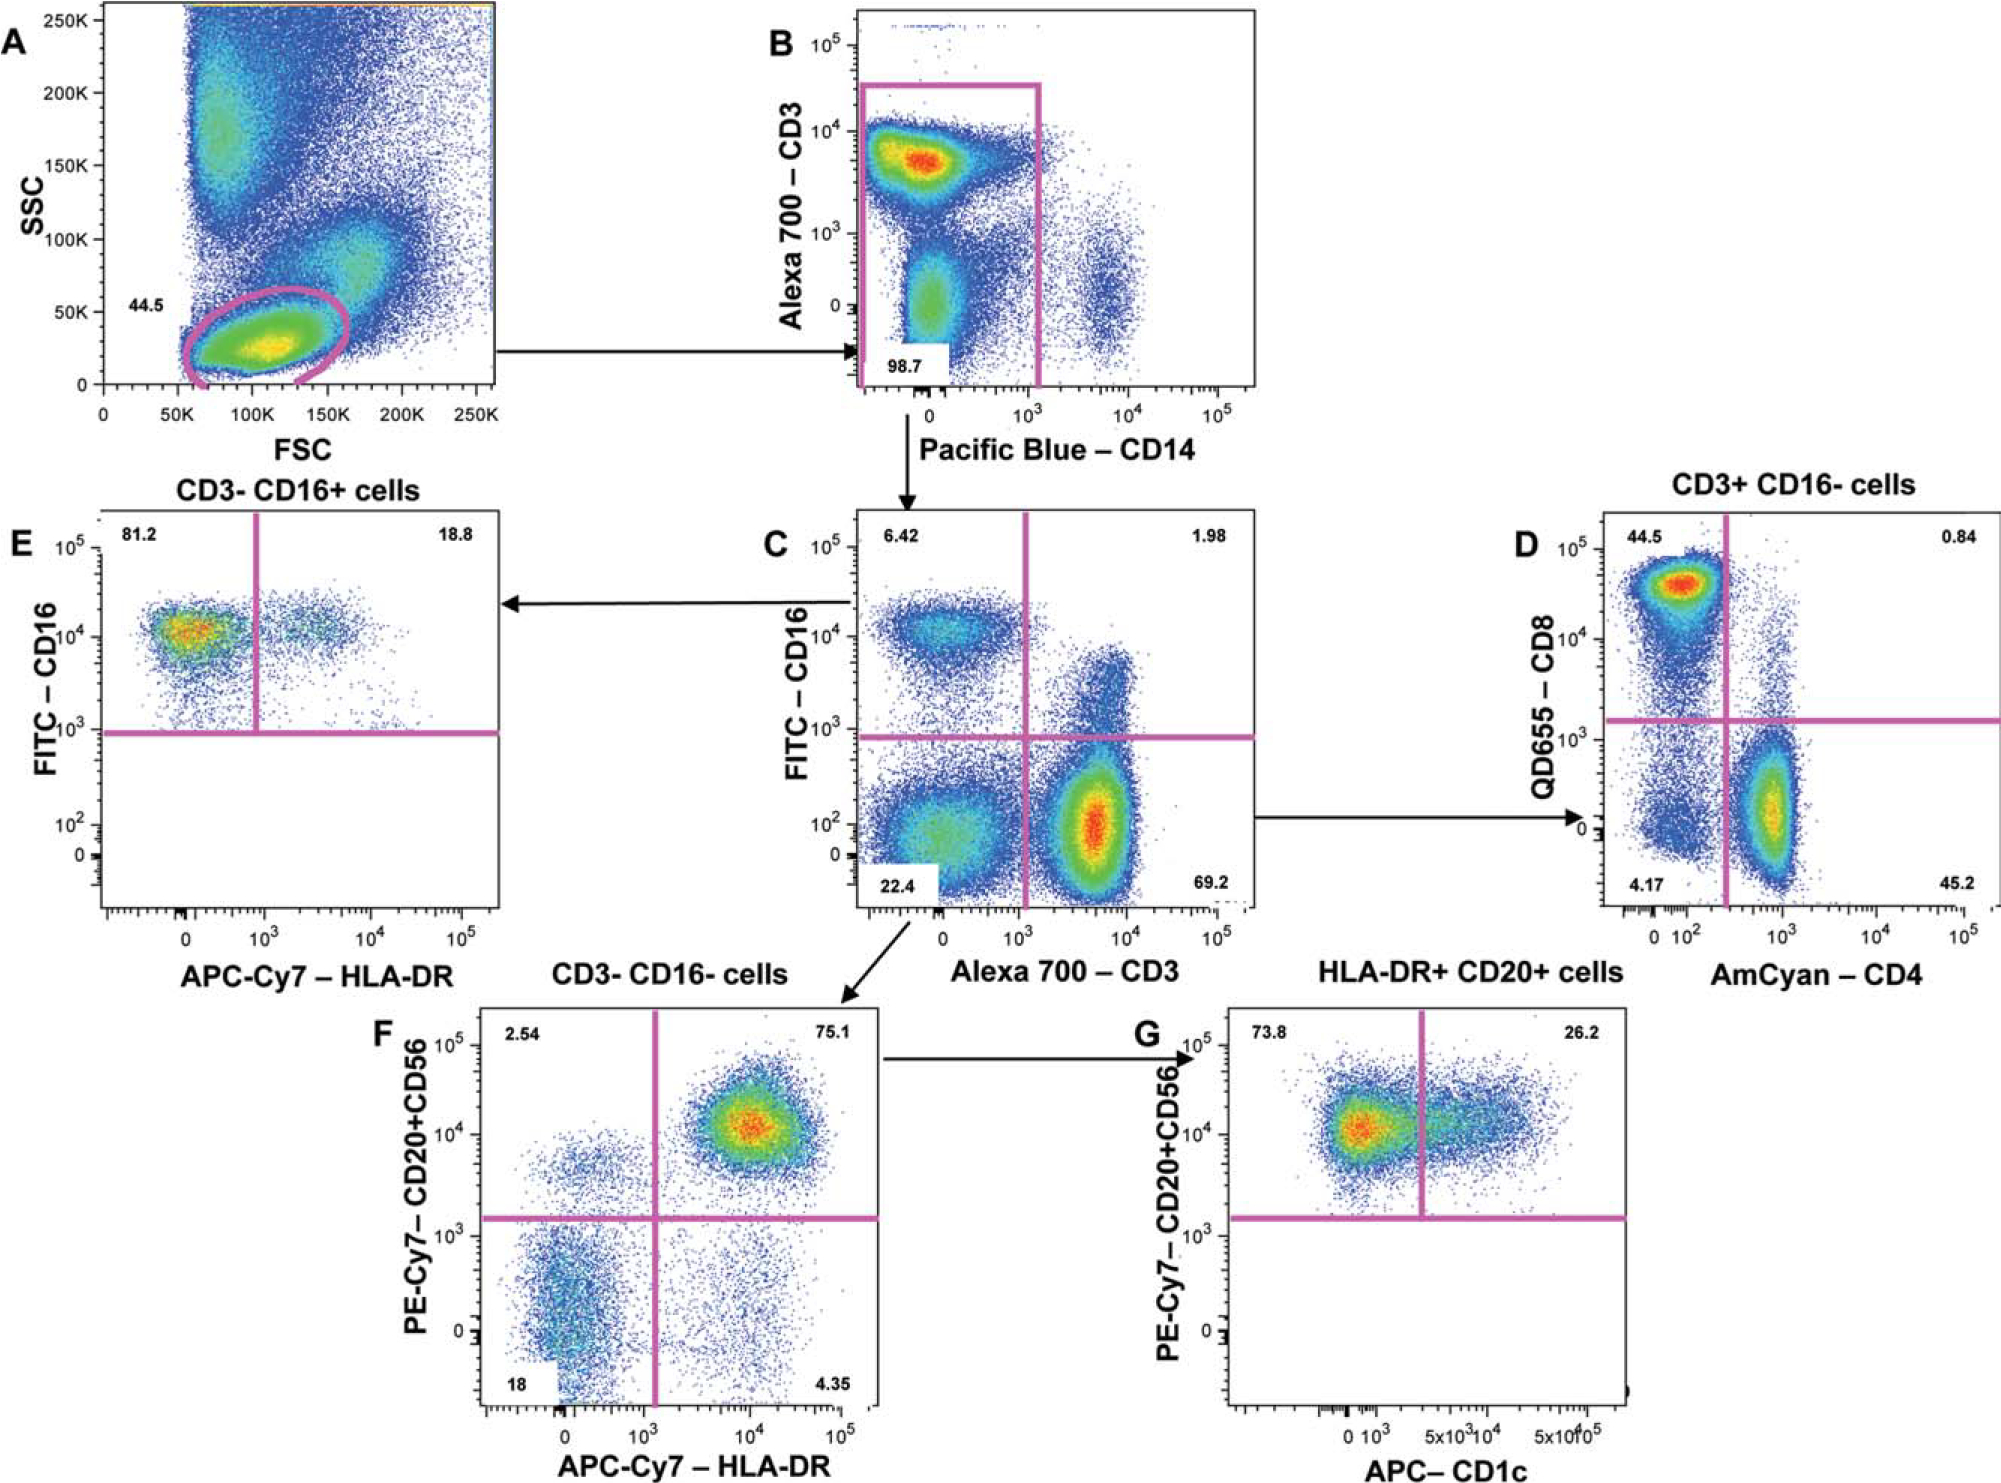
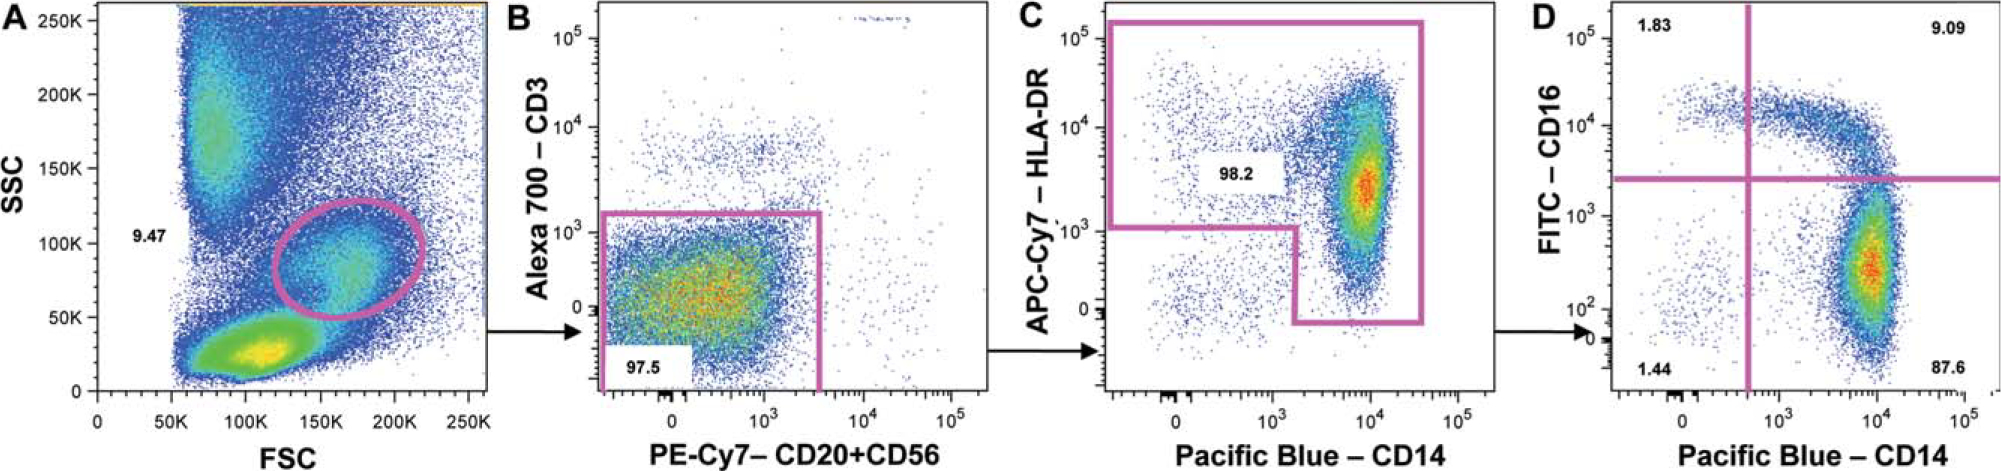
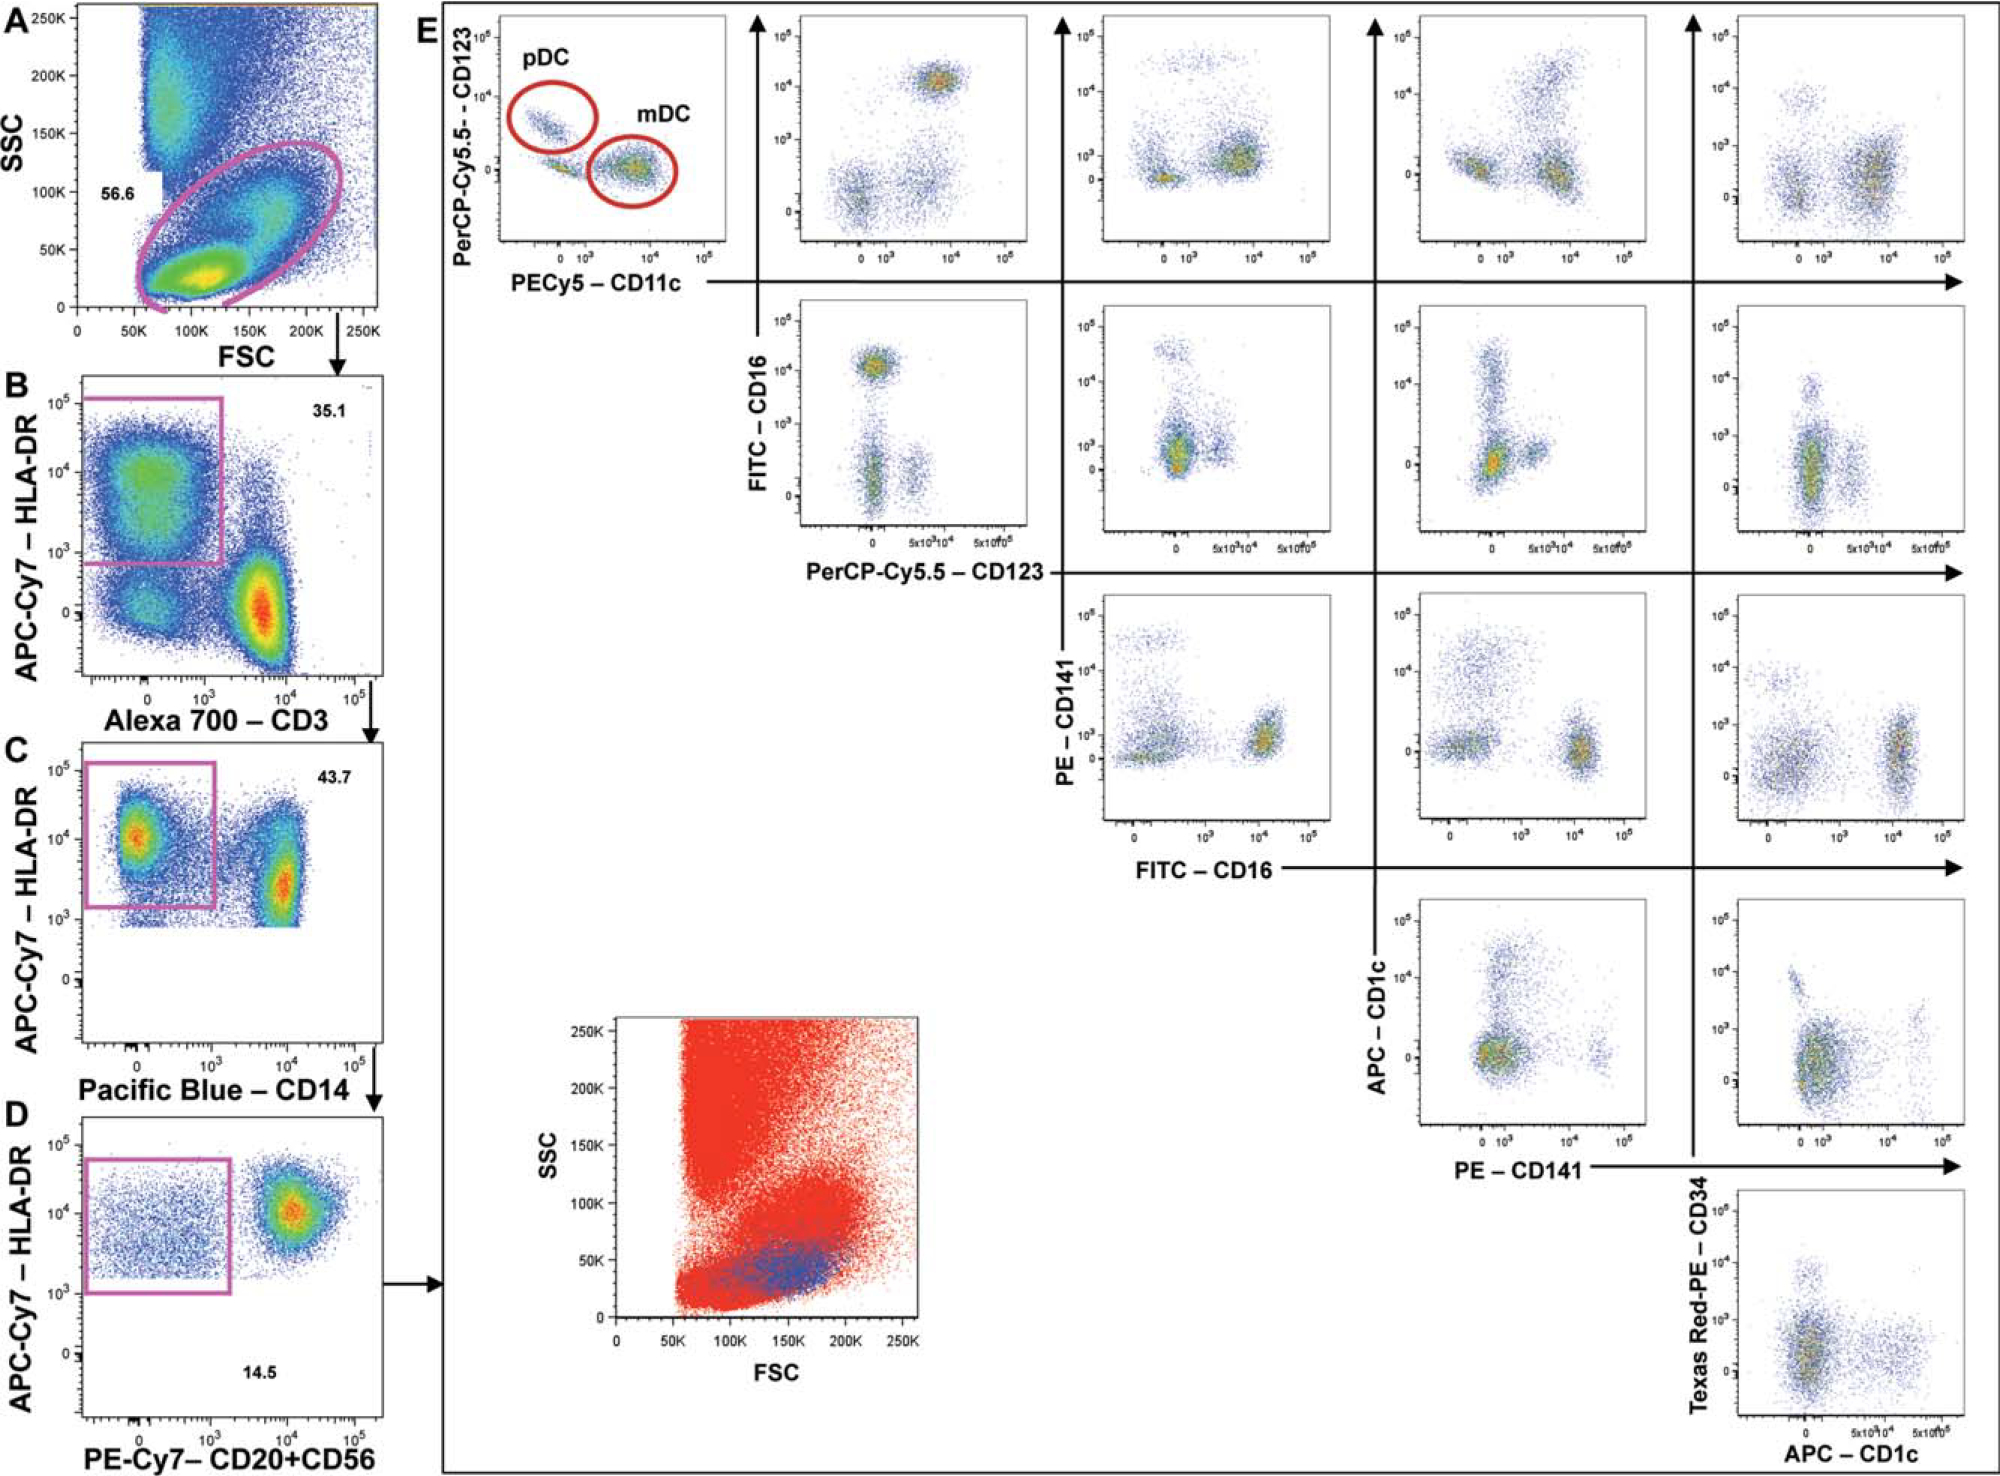
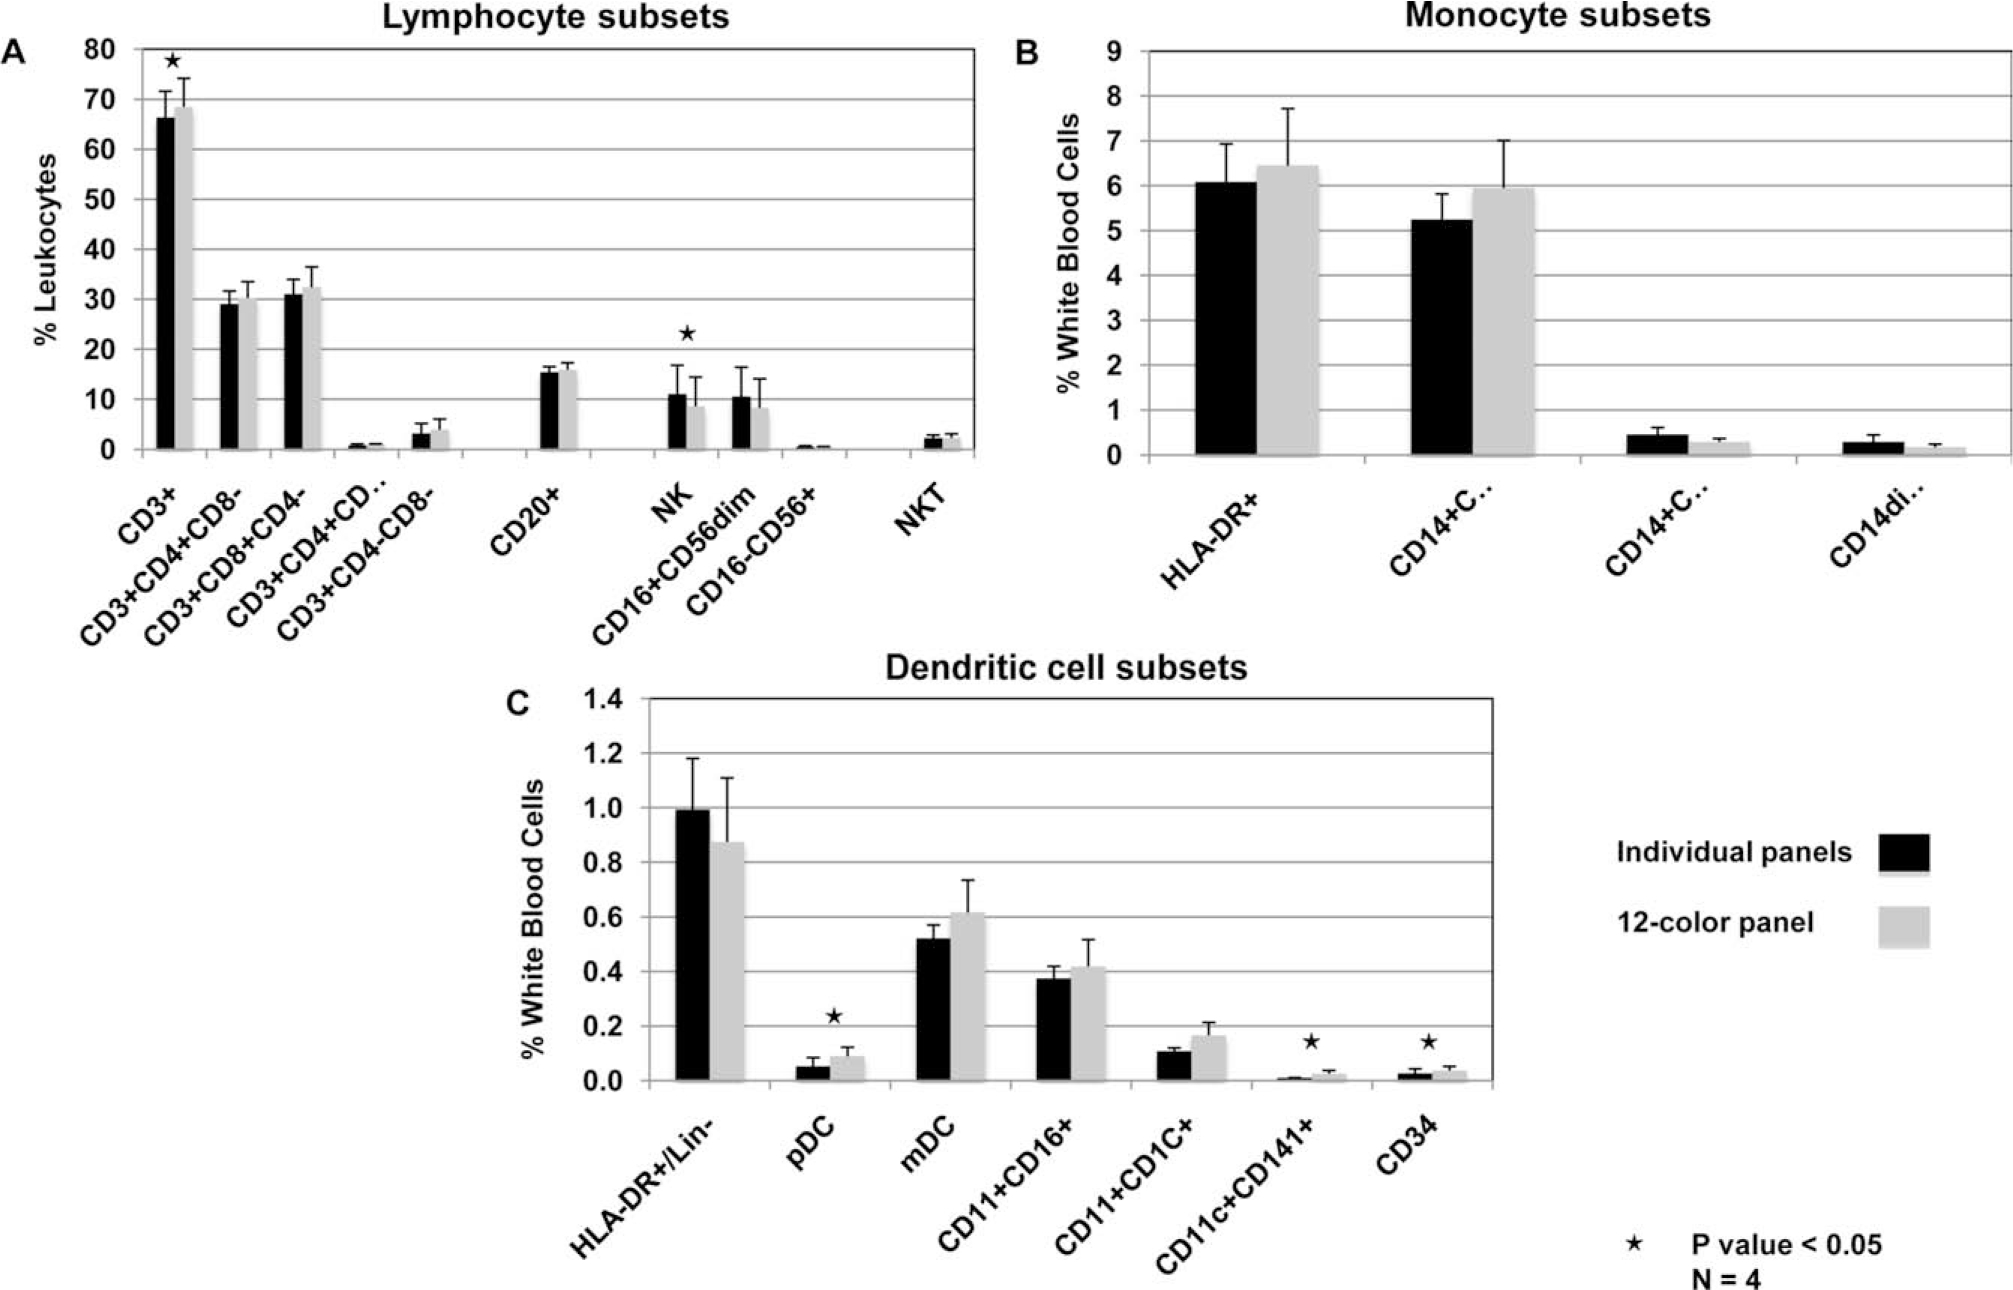
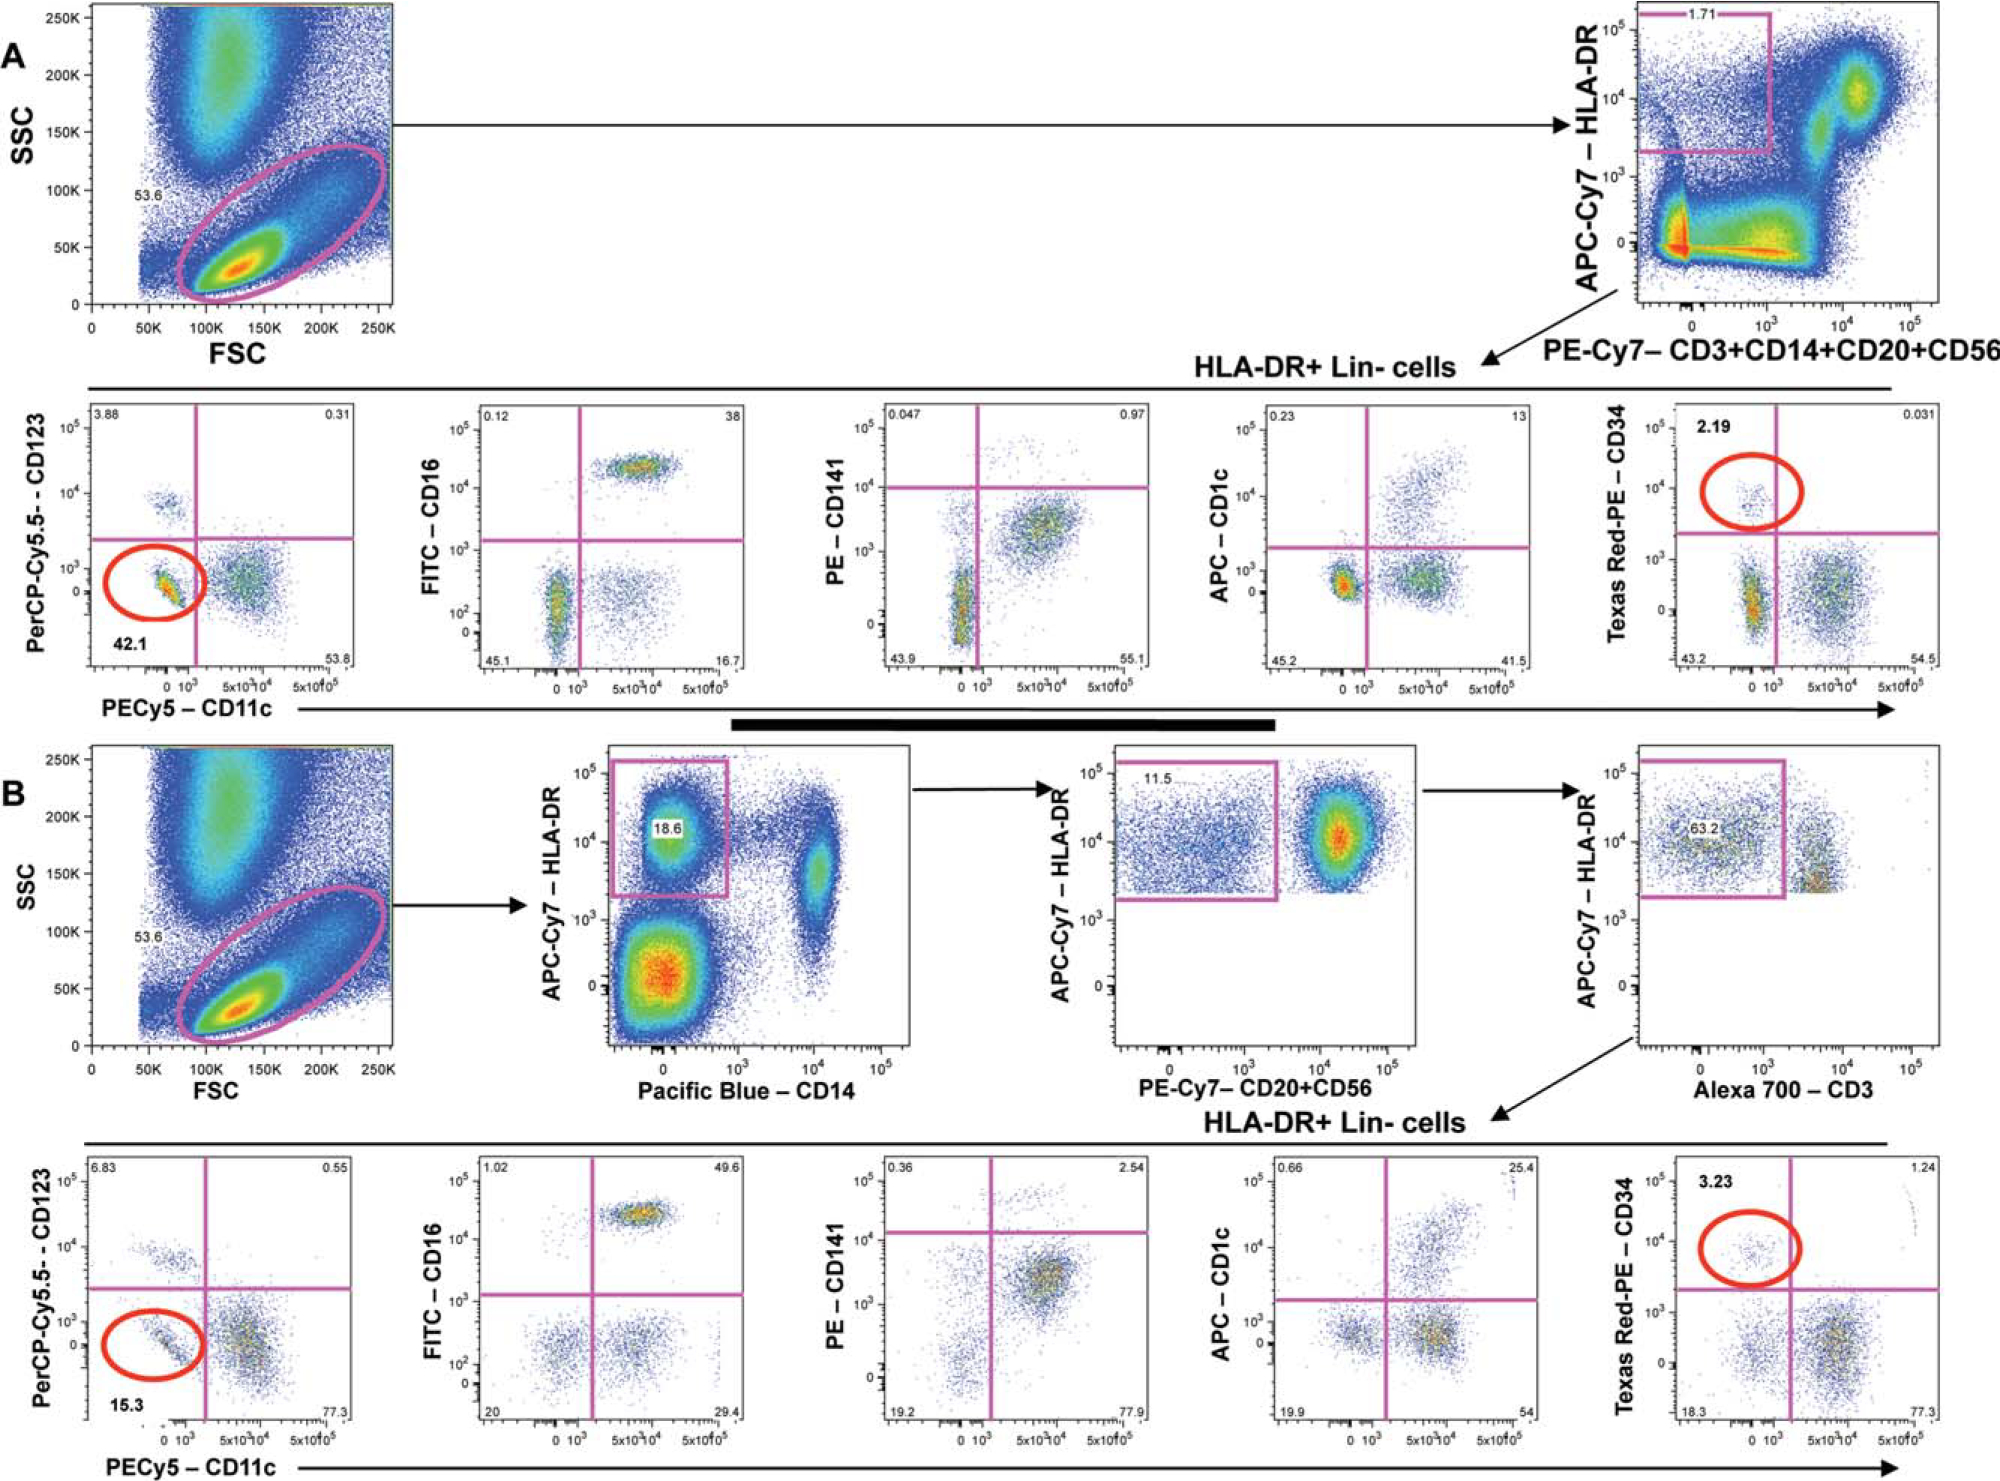
Monitoring changes in human immune cell populations such as lymphocytes, monocytes, and dendritic cells (DCs) during infectious diseases like human immunodeficiency virus (HIV) is crucial. However, difficulties to identify rare or heterogeneous cell populations can be limiting. For example, to accurately measure DC subsets, eight flow cytometry parameters are ideal. The aim of this work was to analyze the phenotype of human lymphocyte, monocyte, and DC subsets using a single 12-color flow cytometry panel. After erythrocyte lysis, blood from healthy human volunteers was washed and labeled with a cocktail of 12 antibodies. Samples were analyzed on a Becton-Dickinson FACSAria equipped with three lasers. Data were compared with lineage-specific panels using 5-8 Ab combinations per lineage. Acquired data were analyzed using FlowJo software. Our 12-color panel allows for the identification of the following major subsets of circulating cells in a single tube: CD4+ and CD8+ T lymphocytes, B lymphocytes, NK cells, NKT cells, monocyte subsets (CD14 and/or CD16), and five nonoverlapping HLA-DR+Lin- subsets: CD34+ hematopoietic stem cells, CD123+ plasmacytoid DC, and three subsets of CD11c+ myeloid DC expressing either CD16, CD1c (BDCA-1), or CD141 (BDCA-3). We have developed a single flow cytometry panel that allows for simultaneous detection of the lymphocyte and monocyte cell populations and all known DC subsets. Studying these major players of the immune system in one single panel may give us a broader view of the immune response during HIV infection and the ability to better define the role of individual cell types in Acquired Immune Deficiency Syndrome (AIDS) pathogenesis. (c) 2010 International Society for Advancement of Cytometry.


Figures

Figure 1.
Figure 1.
Optical configuration of the BD FACSAria. The instrument is equipped with three solid-state lasers: blue (488 nm), red (633 nm), and violet (407 nm). The collection optics are set up in octagon- (blue laser) and trigon-shaped arrays (red and violet lasers), with a series of photomultiplier tubes (PMT) and filters (dichroic and band pass filters), that enable us to measure up to seven parameters for the blue laser and three parameters each for the red and the violet laser, through a system of cascades. For example, the highest wavelengths, longer than 735 nm are transmitted through a 735 long pass filter, and then fine-tuned through a 780/60 bandpass filter that allows transmission between 750 and 810 nm, and then finally counted in the Cy7-PE PMT. The wavelengths shorter than 735 nm are reflected to the next PMT (Cy5.5-PerCP).
Figure 2.
Figure 2.
Flow cytometry analysis of lymphocyte populations from whole blood. First, lymphocytes were gated based on FSC and SSC (A), followed by CD14+ monocyte exclusion (B). T lymphocytes (CD3+CD16−), NK (CD3−CD16+), and NKT (CD3+CD16+) populations were identified using CD3 and CD16 (C). CD4+ and CD8+ lymphocytes were distinguished within the CD3+ T lymphocytes (D). CD16+HLA-DR− NK cells and a CD16+HLA-DR+ mDC subset were distinguished within the CD3−CD16+ population (E). CD56+HLA-DR− NK cells and CD20+HLA-DR+ B cells are distinguished within CD3−CD16− cells (F). Gating on CD20+HLA-DR+ cells, nonresting (CD20+CD1c−) and resting (CD20+CD1c+) B cells are distinguished based on CD1c expression (G). Results presented here are from one donor and are representative of nine donors. Numbers are percentages of each population within the same dotplot.
Figure 3.
Figure 3.
Flow cytometry analysis of monocytes. First, monocytes were gated based on FSC and SSC (A). CD3+ T cells, CD20+ B cells, and CD56+ NK cells were excluded (B). HLA-DR+ and CD14+ cells were selected (C) and three monocyte subsets were gated based on expression of CD14 and/or CD16. These include the classical monocytes (CD14+CD16−) and activated monocytes (CD14+CD16+ and CD14dimCD16+) (D). Granulocytes that are HLA-DR− and CD14 dim are excluded from monocyte analysis, based on FSC vs. SSC and HLA-DR and CD14 expression (Fig. 3C). Results presented here are from one donor and are representative of nine donors. Numbers are percentages of each population within the same dotplot.
Figure 4.
Figure 4.
Flow cytometry analysis of dendritic cells. DCs were gated based on FSC and SSC including both lymphocytes and monocytes (A). HLA-DR+ cells were gated and Lin− cells (i.e., CD3+ T lymphocytes, CD14+ monocytes, CD20+ B lymphocytes, and CD56+ NK cells were excluded (B, C, D). In agreement with the literature, five nonoverlapping Lin2 HLA-DR+ cell subsets are shown in (E) and are distinguished based on CD123, CD1c, CD16, CD141, and CD34 expression. Results presented here are from one donor and are representative of nine donors. Numbers are percentages of each population within the same dotplot.
Figure 5.
Figure 5.
Comparison between individual lineage-specific panels and 12-color panel. (A) lymphocyte subsets, (B) monocyte subsets, and (C) DC subsets. Individual lineage-specific panels and a 12-color panel are described in Table 1. Percentage median and intra quartile range were calculated for each subset (n = 4). Statistical significance was determined by using two-tailed, paired Students’ t-test, where *P < 0.05.
Figure 6.
Figure 6.
Comparison of single channel vs. multichannels for exclusion markers for DC gating. (A) Flow cytometry analysis of DC subsets using an individual lineage-specific panel with exclusion markers in the same channel. (B) Flow cytometry analysis of DC subsets using a 12-color panel with exclusion markers in different channels. Results presented here are from one donor and are representative of four donors. Numbers are percentages of each population within the same dotplot. The contaminating cells within the HLA-DR+ Lin(CD3+CD14+CD20+CD56)− population equals the % of CD123− CD11c− minus the % of CD34+ cells (CD123− CD11c−) (second row, single channel exclusion, 39.91% contamination; fourth row, multichannel exclusion, 12.07% contamination).

Similar articles

Cited by

References

    1. Williams KC, Burdo TH. HIV and SIV infection: The role of cellular restriction and immune responses in viral replication and pathogenesis. APMIS 2009;117:400–412. - PMC - PubMed
    1. Stevenson M HIV-1 pathogenesis. Nat Med 2003;9:853–860. - PubMed
    1. Mattapallil JJ, Douek DC, Hill B, Nishimura Y, Martin M, Roederer M. Massive infection and loss of memory CD4+ T cells in multiple tissues during acute SIV infection. Nature 2005;434:1093–1097. - PubMed
    1. Schmitz JE, Kuroda MJ, Santra S, Sasseville VG, Simon MA, Lifton MA, Racz P, Tenner-Racz K, Dalesandro M, Scallon BJ, Ghrayeb J, Forman MA, Montefiori DC, Rieber EP, Letvin NL, Reimann KA. Control of viremia in simian immunodeficiency virus infection by CD8+ lymphocytes. Science 1999;283:857–860. - PubMed
    1. Zhang D, Shankar P, Xu Z, Harnisch B, Chen G, Lange C, Lee SJ, Valdez H, Lederman MM, Lieberman J. Most antiviral CD8 T cells during chronic viral infection do not express high levels of perforin and are not directly cytotoxic. Blood 2003;101:226–235. - PubMed

Publication types

LinkOut - more resources