

Relationships of brain white matter microstructure with clinical and MR measures in relapsing-remitting multiple sclerosis
- PMID: 20099343
- PMCID: PMC7610900
- DOI: 10.1002/jmri.22062
Relationships of brain white matter microstructure with clinical and MR measures in relapsing-remitting multiple sclerosis
Abstract
Purpose: To assess the relationships of microstructural damage in the cerebral white matter (WM), as measured by diffusion tensor imaging (DTI), with clinical parameters and magnetic resonance imaging (MRI) measures of focal tissue damage in patients with multiple sclerosis (MS).
Materials and methods: Forty-five relapsing-remitting (RR) MS patients (12 male, 33 female; median age = 29 years, Expanded Disability Status Scale (EDSS) = 1.5, disease duration = 3 years) were studied. T2-lesion masks were created and voxelwise DTI analyses performed with Tract-Based Spatial Statistics (TBSS).
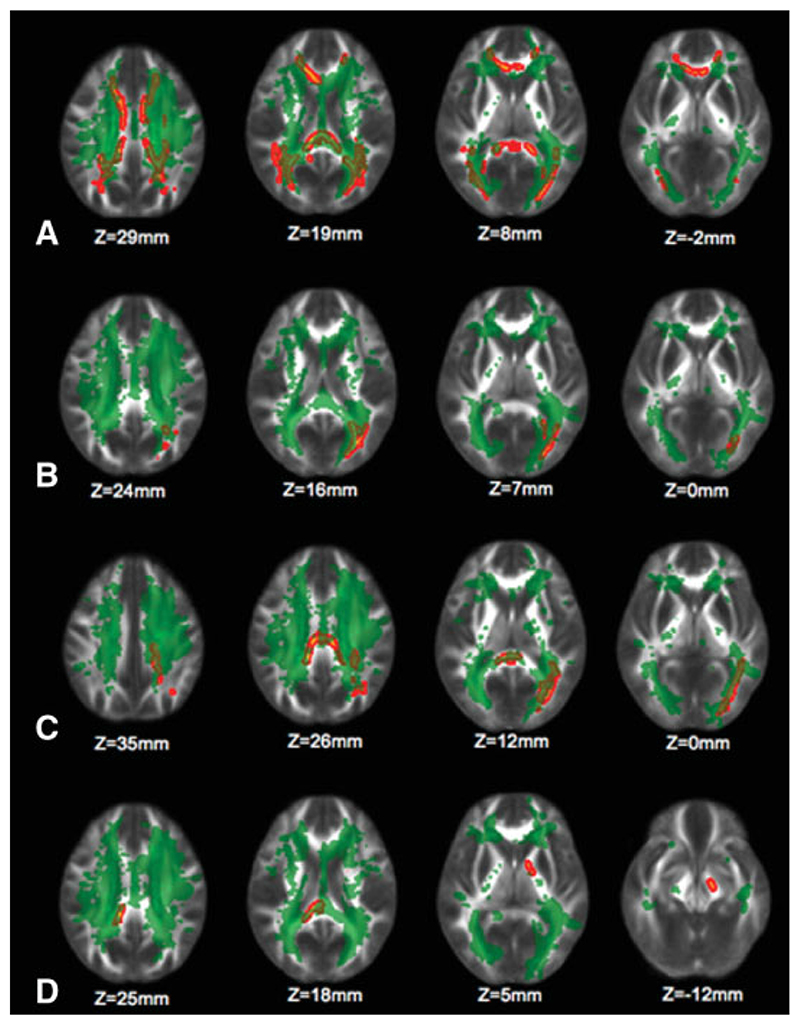
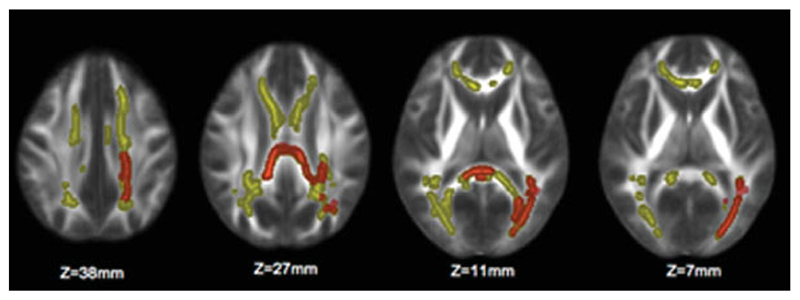
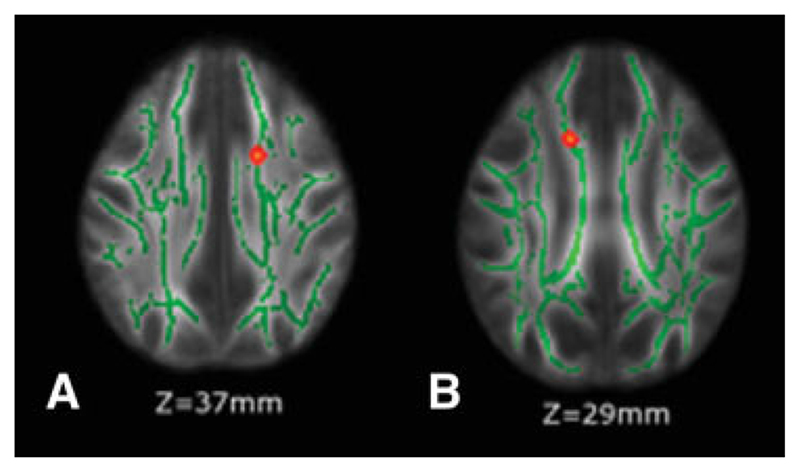
Results: T2-lesion volume (T2-LV) was significantly (P < 0.05, corrected) correlated with fractional anisotropy (FA) in both lesions and normal-appearing WM (NAWM). Relationships (P = 0.08, corrected) between increasing EDSS score and decreasing FA were found in the splenium of the corpus callosum (sCC) and along the pyramidal tract (PY). All FA associations were driven by changes in the perpendicular (to primary tract direction) diffusivity. No significant global and voxelwise FA changes were found over a 2-year follow-up.
Conclusion: FA changes related to clinical disability in RR-MS patients with minor clinical disability are localized to specific WM tracts such as the sCC and PY and are driven by changes in perpendicular diffusivity both within lesions and NAWM. Longitudinal DTI measurements do not seem able to chart the early disease course in the WM of MS patients.
Figures
Similar articles
-
Injury to white matter tracts in relapsing-remitting multiple sclerosis: A possible therapeutic window within the first 5 years from onset using diffusion-tensor imaging tract-based spatial statistics.Neuroimage Clin. 2015 Apr 30;8:261-6. doi: 10.1016/j.nicl.2015.04.020. eCollection 2015. Neuroimage Clin. 2015. PMID: 26106550 Free PMC article.
-
Microstructural alterations in different types of lesions and their perilesional white matter in relapsing-remitting multiple sclerosis based on diffusion kurtosis imaging.Mult Scler Relat Disord. 2023 Mar;71:104572. doi: 10.1016/j.msard.2023.104572. Epub 2023 Feb 19. Mult Scler Relat Disord. 2023. PMID: 36821979
-
Intrinsic damage to the major white matter tracts in patients with different clinical phenotypes of multiple sclerosis: a voxelwise diffusion-tensor MR study.Radiology. 2011 Aug;260(2):541-50. doi: 10.1148/radiol.11110315. Epub 2011 Jun 14. Radiology. 2011. PMID: 21673227
-
The role of diffusion tensor imaging and fractional anisotropy in the evaluation of patients with idiopathic normal pressure hydrocephalus: a literature review.Neurosurg Focus. 2016 Sep;41(3):E12. doi: 10.3171/2016.6.FOCUS16192. Neurosurg Focus. 2016. PMID: 27581308 Review.
-
Diffusion MRI in multiple sclerosis.Neurology. 2005 Nov 22;65(10):1526-32. doi: 10.1212/01.wnl.0000184471.83948.e0. Neurology. 2005. PMID: 16301477 Review.
Cited by
-
Diffusion Tensor Imaging in NAWM and NADGM in MS and CIS: Association with Candidate Biomarkers in Sera.Mult Scler Int. 2013;2013:265259. doi: 10.1155/2013/265259. Epub 2013 Dec 17. Mult Scler Int. 2013. PMID: 24455265 Free PMC article.
-
White and gray matter integrity evaluated by MRI-DTI can serve as noninvasive and reliable indicators of structural and functional alterations in chronic neurotrauma.Sci Rep. 2024 Mar 27;14(1):7244. doi: 10.1038/s41598-024-57706-7. Sci Rep. 2024. PMID: 38538745 Free PMC article.
-
Comparing MRI metrics to quantify white matter microstructural damage in multiple sclerosis.Hum Brain Mapp. 2019 Jul;40(10):2917-2932. doi: 10.1002/hbm.24568. Epub 2019 Mar 19. Hum Brain Mapp. 2019. PMID: 30891838 Free PMC article.
-
The association between white matter tract structural connectivity and information processing speed in relapsing-remitting multiple sclerosis.Neurol Sci. 2023 Sep;44(9):3221-3232. doi: 10.1007/s10072-023-06817-6. Epub 2023 Apr 27. Neurol Sci. 2023. PMID: 37103603 Free PMC article.
-
Mapping the Progressive Treatment-Related Reduction of Active MRI Lesions in Multiple Sclerosis.Front Neurol. 2020 Nov 20;11:585296. doi: 10.3389/fneur.2020.585296. eCollection 2020. Front Neurol. 2020. PMID: 33329329 Free PMC article.
References
-
- Miller DH, Thompson AJ, Filippi M. Magnetic resonance studies of abnormalities in the normal appearing white matter and grey matter in multiple sclerosis. J Neurol. 2003;250:1407–1419. - PubMed
-
- De Stefano N, Battaglini M, Smith SM. Measuring brain atrophy in multiple sclerosis. J Neuroimaging. 2007;17(Suppl 1):10S–15S. - PubMed
-
- Giorgio A, Battaglini M, Smith SM, De Stefano N. Brain atrophy assessment in multiple sclerosis: importance and limitations. Neuroimaging Clin N Am. 2008;18:675–686. - PubMed
-
- Pierpaoli C, Basser PJ. Toward a quantitative assessment of diffusion anisotropy. Magn Reson Med. 1996;36:893–906. - PubMed
-
- Griffin CM, Chard DT, Ciccarelli O, et al. Diffusion tensor imaging in early relapsing-remitting multiple sclerosis. Mult Scler (Houndmills, Basingstoke, England) 2001;7:290–297. - PubMed
Publication types
MeSH terms
Substances
Grants and funding
LinkOut - more resources
Full Text Sources
Research Materials
