

Quantification of 3D regional myocardial wall thickening from gated magnetic resonance images
- PMID: 20099344
- PMCID: PMC2945248
- DOI: 10.1002/jmri.22033
Quantification of 3D regional myocardial wall thickening from gated magnetic resonance images
Abstract
Purpose: To develop 3D quantitative measures of regional myocardial wall motion and thickening using cardiac magnetic resonance imaging (MRI) and to validate them by comparison to standard visual scoring assessment.
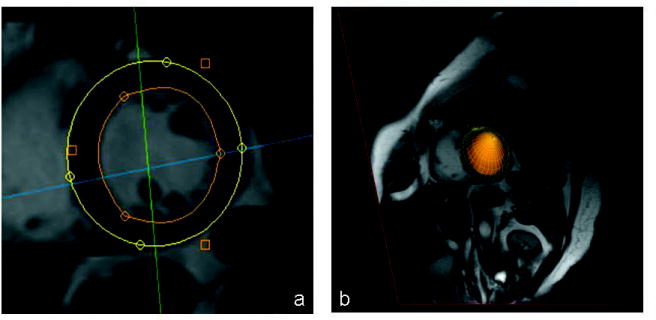
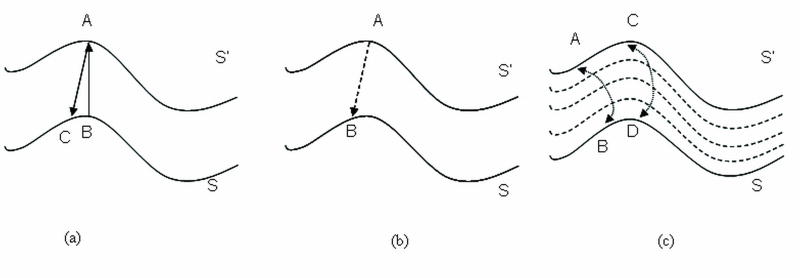
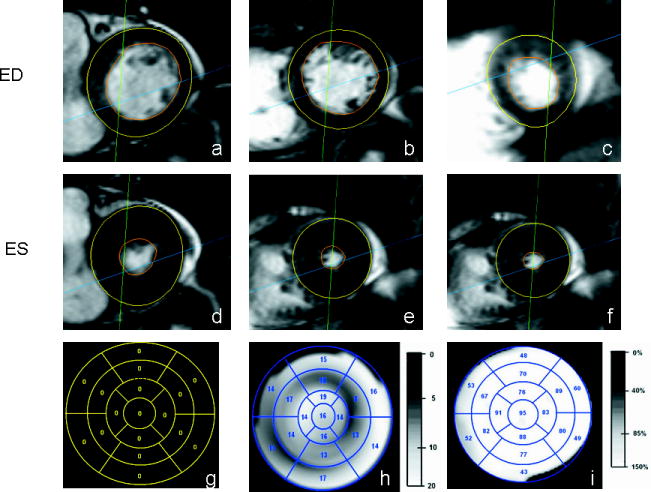
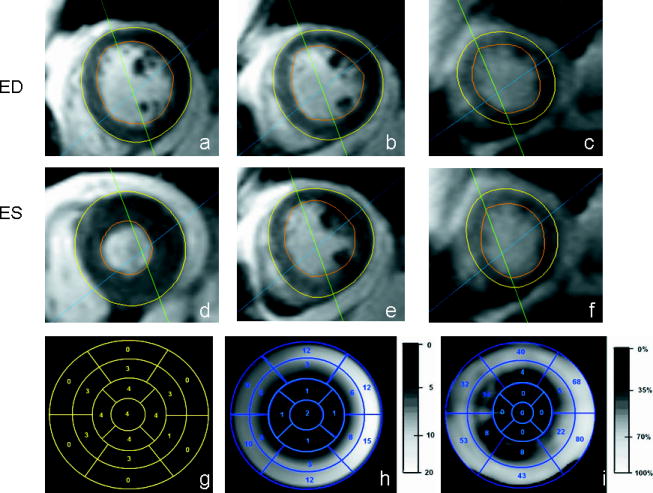
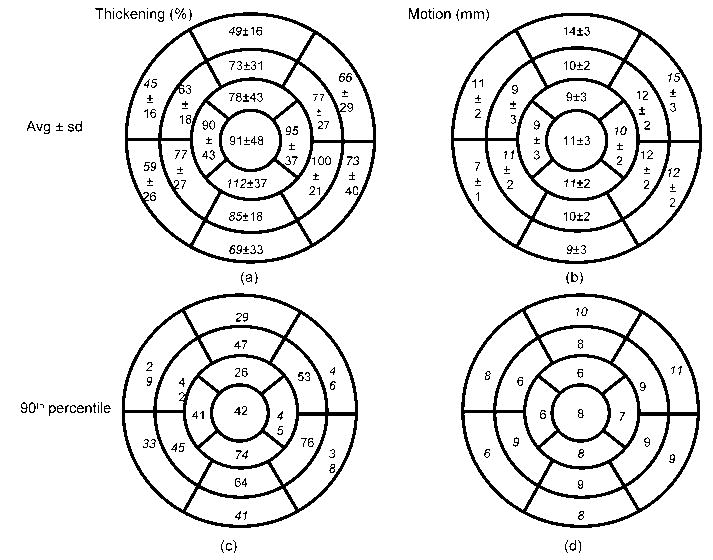
Materials and methods: In all, 53 consecutive subjects with short-axis slices and mid-ventricular 2-chamber/4-chamber views were analyzed. After correction for breath-hold-related misregistration, 3D myocardial boundaries were fitted to images and edited by an imaging cardiologist. Myocardial thickness was quantified at end-diastole and end-systole by computing the 3D distances using Laplace's equation. 3D thickening was represented using the standard 17-segment polar coordinates. 3D thickening was compared with 3D wall motion and with expert visual scores (6-point visual scoring of wall motion and wall thickening; 0 = normal; 5 = greatest abnormality) assigned by imaging cardiologists.
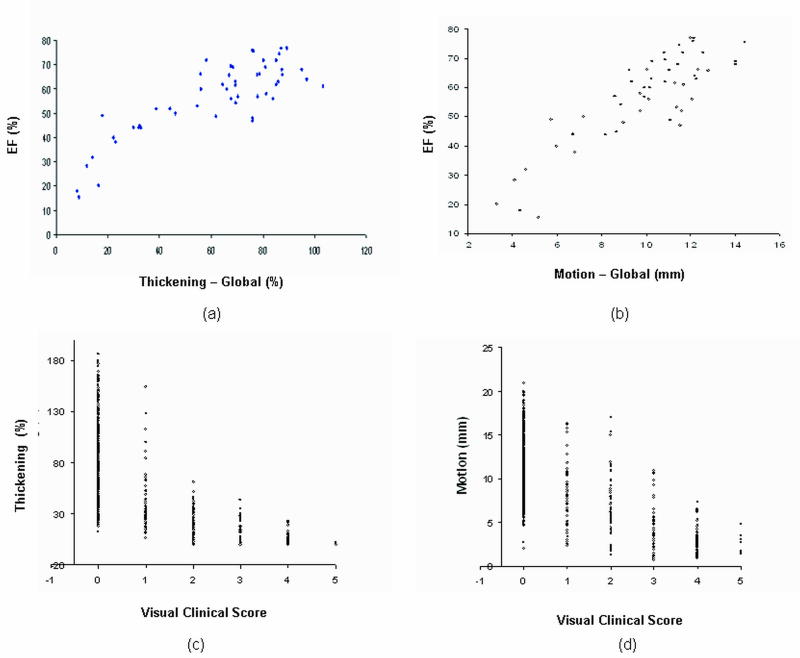
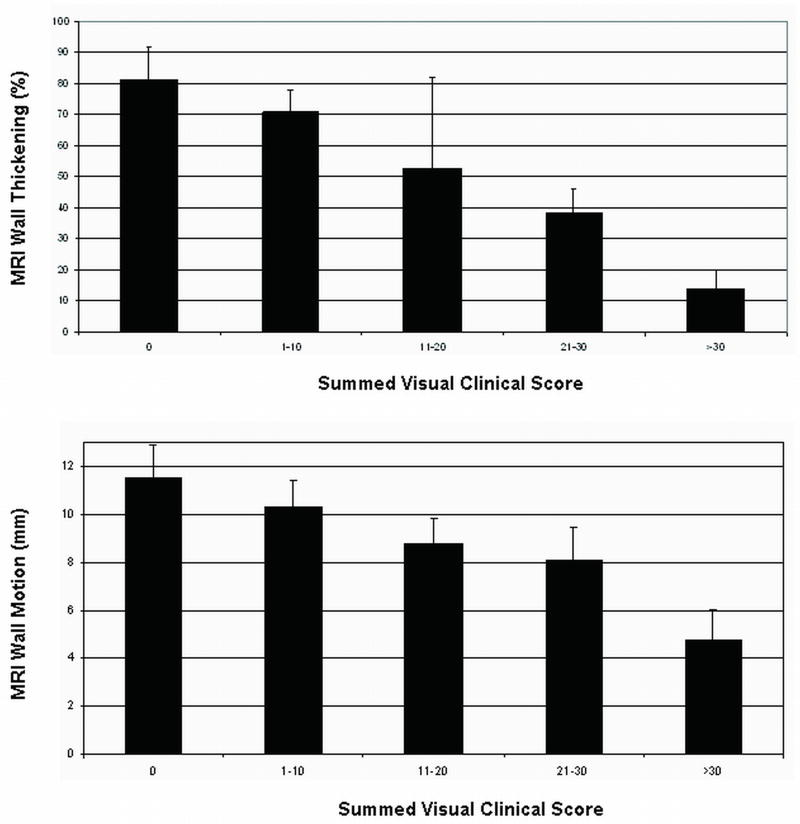
Results: Correlation between ejection fraction and thickening measurements was (r = 0.84; P < 0.001) compared to correlation between ejection fraction and motion measurements (r = 0.86; P < 0.001). Good negative correlation between summed visual scores and global wall thickening and motion measurements were also obtained (r(thick) = -0.79; r(motion) = -0.74). Additionally, overall good correlation between individual segmental visual scores with thickening/wall motion (r(thick) = -0.69; r(motion) = -0.65) was observed (P < 0.0001).
Conclusion: 3D quantitative regional thickening and wall motion measures obtained from MRI correlate strongly with expert clinical scoring.
Figures
Similar articles
-
Myocardial wall thickening from gated Magnetic Resonance images using Laplace's equation.Proc SPIE Int Soc Opt Eng. 2009 Feb 10;7260:72602I. doi: 10.1117/12.811411. Proc SPIE Int Soc Opt Eng. 2009. PMID: 20835373 Free PMC article.
-
Three-dimensional cardiac cine imaging using the kat ARC acceleration: Initial experience in clinical adult patients at 3T.Magn Reson Imaging. 2015 Sep;33(7):911-7. doi: 10.1016/j.mri.2015.04.004. Epub 2015 Apr 30. Magn Reson Imaging. 2015. PMID: 25936683
-
Assessment of left ventricular myocardial scar in coronary artery disease by a three-dimensional MR imaging technique.J Magn Reson Imaging. 2013 Jul;38(1):72-9. doi: 10.1002/jmri.23962. Epub 2012 Dec 7. J Magn Reson Imaging. 2013. PMID: 23225643
-
Validation of quantitative gated single photon emission computed tomography and an automated scoring system for the assessment of regional left ventricular systolic function.Nucl Med Commun. 2002 Sep;23(9):887-98. doi: 10.1097/00006231-200209000-00013. Nucl Med Commun. 2002. PMID: 12195094 Clinical Trial.
-
Detection of cardiovascular disease in elite athletes using cardiac magnetic resonance imaging.Rofo. 2013 Dec;185(12):1167-74. doi: 10.1055/s-0033-1350130. Epub 2013 Jul 29. Rofo. 2013. PMID: 23897528 Review.
Cited by
-
Time-efficient three-dimensional transmural scar assessment provides relevant substrate characterization for ventricular tachycardia features and long-term recurrences in ischemic cardiomyopathy.Sci Rep. 2021 Sep 28;11(1):18722. doi: 10.1038/s41598-021-97399-w. Sci Rep. 2021. PMID: 34580343 Free PMC article.
References
-
- Sakuma H, Fujia N, Foo TKF, et al. Evaluation of left ventricular volume and mass with breath-hold cine MR imaging. Radiology. 1993;188:377–380. - PubMed
-
- Young AA, Kramer CM, Ferrari VA, Axel L, Reichek N. Three dimensional left ventricular deformation in hypertrophic cardiomyopathy. Circulation. 1994;90:854–867. - PubMed
-
- Epstein FH. MRI of left ventricular function. J Nuclear Cardiology. 2007;14(5):729–744. - PubMed
-
- Haag UJ, Maier SE, Jakob M, et al. Left ventricular wall thickness measurements by magnetic resonance: a validation study. Int J Cardiac Imag. 1991;7:31–41. - PubMed
-
- Van Rugge FP, Van der Wall EE, Spanjersberg SJ, et al. Magnetic resonance imaging during dobutamine stress for detection of coronary artery disease; quantitative wall motion analysis using a modification of the centerline method. Circulation. 1994;90:127–138. - PubMed
Publication types
MeSH terms
Grants and funding
LinkOut - more resources
Full Text Sources
Other Literature Sources
Medical
