

Impact of design parameters on bileaflet mechanical heart valve flow dynamics
- PMID: 20099695
- PMCID: PMC2863996
Impact of design parameters on bileaflet mechanical heart valve flow dynamics
Abstract
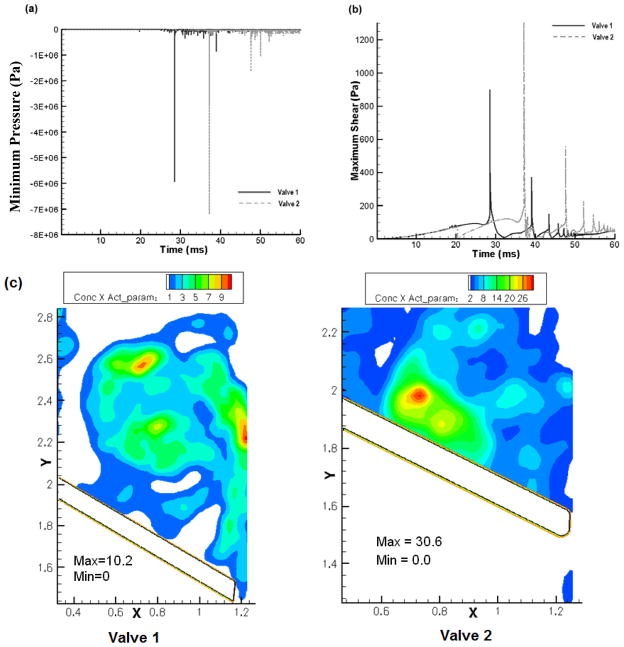
Background and aim of the study: One significant problem encountered during surgery to implant mechanical heart valve prostheses is the propensity for thrombus formation near the valve leaflet and housing. This may be caused by the high shear stresses present in the leakage jet flows through small gaps between leaflets and the valve housing during the valve closure phase.
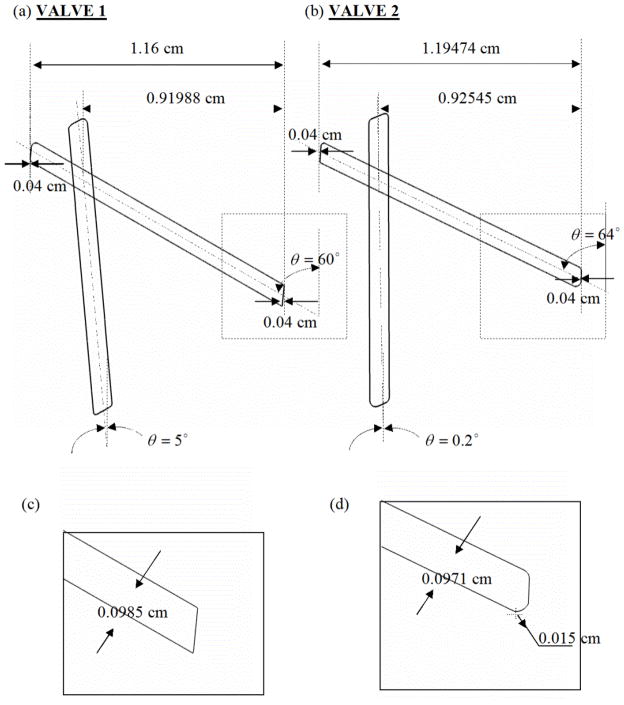
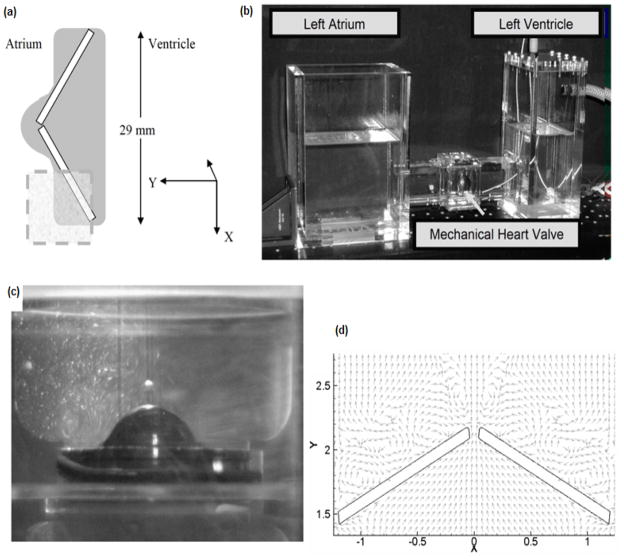
Methods: A two-dimensional (2D) study was undertaken to demonstrate that design changes in bileaflet mechanical valves result in notable changes in the flow-induced stresses and prediction of platelet activation. A Cartesian grid technique was used for the 2D simulation of blood flow through two models of bileaflet mechanical valves, and their flow patterns, closure characteristics and platelet activation potential were compared. A local mesh refinement algorithm allowed efficient and fast flow computations with mesh adaptation based on the gradients of the flow field in the gap between the leaflet and housing at the instant of valve closure. Leaflet motion was calculated dynamically, based on the fluid forces acting on it. Platelets were modeled and tracked as point particles by a Lagrangian particle tracking method which incorporated the hemodynamic forces on the particles.
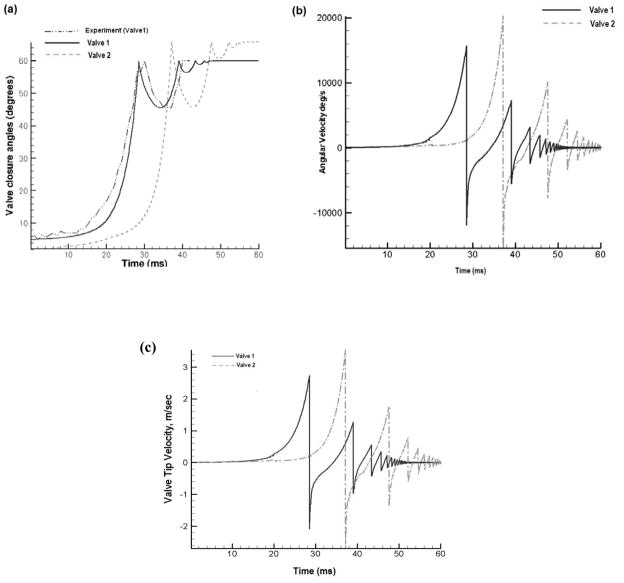
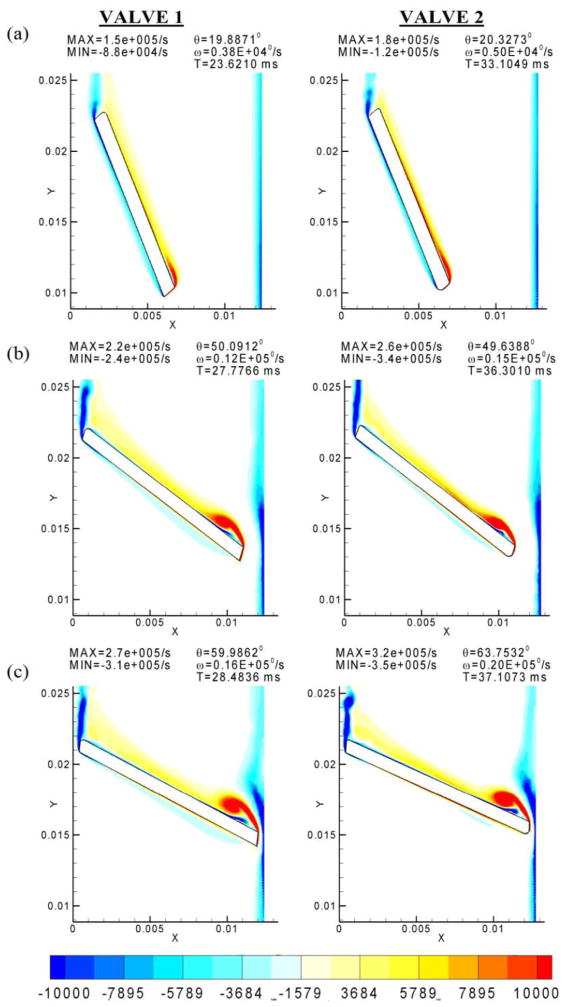
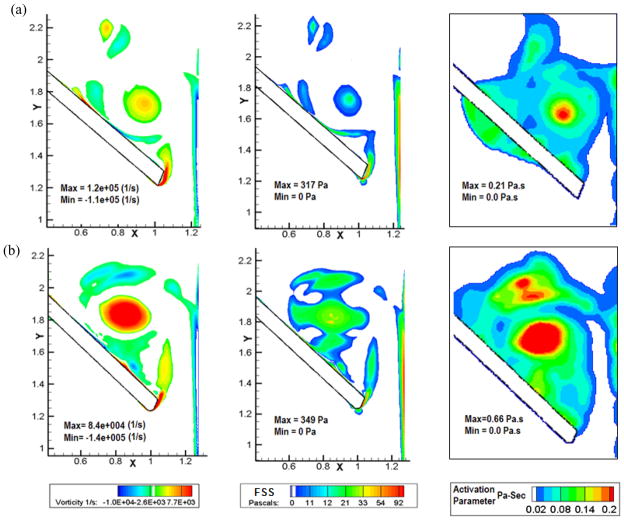
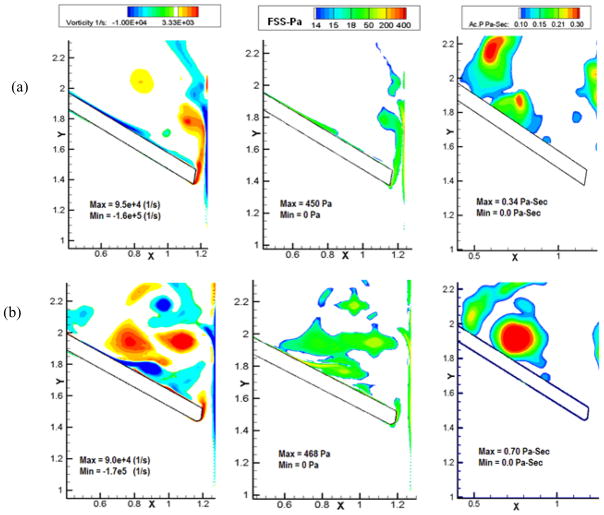
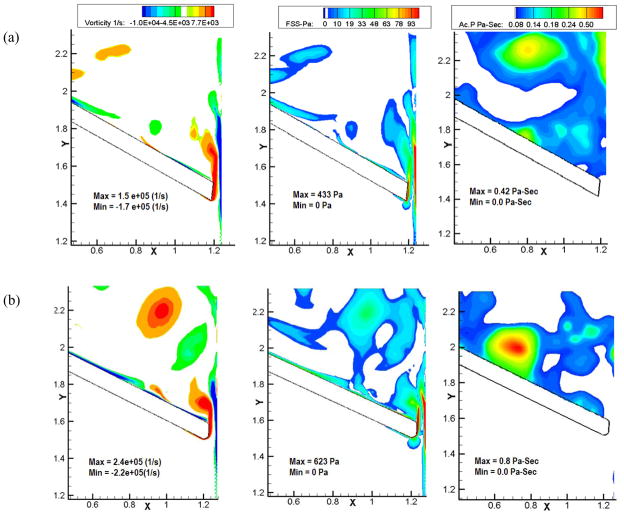
Results: A comparison of results showed that the velocity, wall shear stress and simulated platelet activation parameter were lower in the valve model, with a smaller angle of leaflet traverse between the fully open to the fully closed position. The parameters were also affected to a lesser extent by local changes in the leaflet and housing geometry.
Conclusion: Computational simulations can be used to examine local design changes to help minimize the fluid-induced stresses that may play a key role in thrombus initiation with the implanted mechanical valves.
Figures
Similar articles
-
Two-dimensional dynamic simulation of platelet activation during mechanical heart valve closure.Ann Biomed Eng. 2006 Oct;34(10):1519-34. doi: 10.1007/s10439-006-9194-5. Epub 2006 Sep 30. Ann Biomed Eng. 2006. PMID: 17013660
-
Two-dimensional simulation of flow and platelet dynamics in the hinge region of a mechanical heart valve.J Biomech Eng. 2009 Mar;131(3):031002. doi: 10.1115/1.3005158. J Biomech Eng. 2009. PMID: 19154061 Free PMC article.
-
Comparison of the hemodynamic and thrombogenic performance of two bileaflet mechanical heart valves using a CFD/FSI model.J Biomech Eng. 2007 Aug;129(4):558-65. doi: 10.1115/1.2746378. J Biomech Eng. 2007. PMID: 17655477
-
Flow in prosthetic heart valves: state-of-the-art and future directions.Ann Biomed Eng. 2005 Dec;33(12):1689-94. doi: 10.1007/s10439-005-8759-z. Ann Biomed Eng. 2005. PMID: 16389514 Review.
-
A review of state-of-the-art numerical methods for simulating flow through mechanical heart valves.Med Biol Eng Comput. 2009 Mar;47(3):245-56. doi: 10.1007/s11517-009-0438-z. Epub 2009 Feb 5. Med Biol Eng Comput. 2009. PMID: 19194734 Free PMC article. Review.
Cited by
-
Two-dimensional FSI simulation of closing dynamics of a tilting disc mechanical heart valve.J Med Device. 2010 Mar 1;4(1):11001. doi: 10.1115/1.4000876. J Med Device. 2010. PMID: 20209095 Free PMC article.
-
Lagrangian postprocessing of computational hemodynamics.Ann Biomed Eng. 2015 Jan;43(1):41-58. doi: 10.1007/s10439-014-1070-0. Epub 2014 Jul 25. Ann Biomed Eng. 2015. PMID: 25059889 Free PMC article. Review.
-
Patient-specific bicuspid valve dynamics: overview of methods and challenges.J Biomech. 2013 Jan 18;46(2):208-16. doi: 10.1016/j.jbiomech.2012.10.038. Epub 2012 Nov 24. J Biomech. 2013. PMID: 23182904 Free PMC article. Review.
-
Numerical investigation of the performance of three hinge designs of bileaflet mechanical heart valves.Ann Biomed Eng. 2010 Nov;38(11):3295-310. doi: 10.1007/s10439-010-0086-3. Epub 2010 Jun 23. Ann Biomed Eng. 2010. PMID: 20571852 Free PMC article.
-
Reduction of Pressure Gradient and Turbulence Using Vortex Generators in Prosthetic Heart Valves.Ann Biomed Eng. 2019 Jan;47(1):85-96. doi: 10.1007/s10439-018-02128-6. Epub 2018 Sep 12. Ann Biomed Eng. 2019. PMID: 30209706 Free PMC article.
References
-
- Chandran KB. Heart Valve Prostheses. John Wiley and Sons; New York: 2006.
-
- Yoganathan AP, Chandran KB, Sotiropoulos F. Flow in prosthetic heart valves: state-of-the-art and future directions. Ann Biomed Eng. 2005;33:1689–1694. - PubMed
-
- Dumont K, Vierendeels J, Kaminsky R, van Nooten G, Verdonck P, Bluestein D. Comparison of the Hemodynamic and Thrombogenic Performance of Two Bileaflet Mechanical Heart Valves Using a CFD/FSI Model. Journal of Biomechanical Engineering. 2007;129:558–566. - PubMed
-
- Ge L, Leo HL, Sotiropoulos F, Yoganathan AP. Flow in a mechanical bileaflet heart valve at laminar and near-peak systole flow rates: CFD simulations and experiments. J Biomech Eng. 2005;127:782–797. - PubMed
-
- Shi Y, Zhao Y, Yeo TJ, Hwang NH. Numerical simulation of opening process in a bileaflet mechanical heart valve under pulsatile flow condition. J Heart Valve Dis. 2003;12:245–255. - PubMed
Publication types
MeSH terms
Grants and funding
LinkOut - more resources
Full Text Sources
Research Materials
Miscellaneous