

Regional mitral leaflet opening during acute ischemic mitral regurgitation
- PMID: 20099707
- PMCID: PMC2863307
Regional mitral leaflet opening during acute ischemic mitral regurgitation
Abstract
Background and aim of the study: Diastolic mitral valve (MV) opening characteristics during ischemic mitral regurgitation (IMR) are poorly characterized. The diastolic MV opening dynamics were quantified along the entire valvular coaptation line in an ovine model of acute IMR.
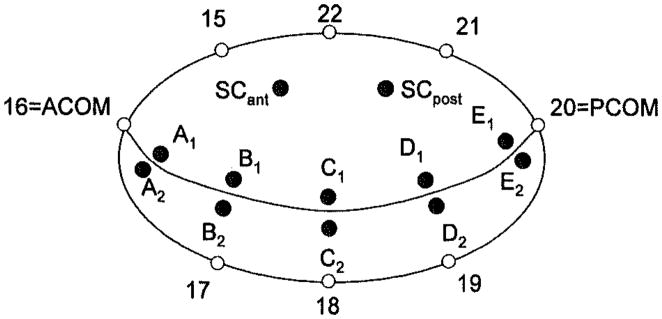
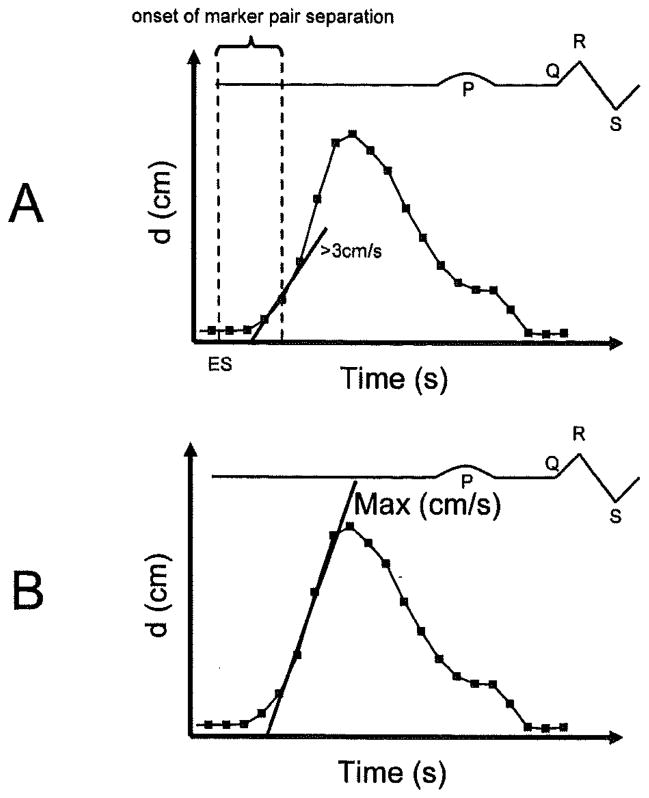
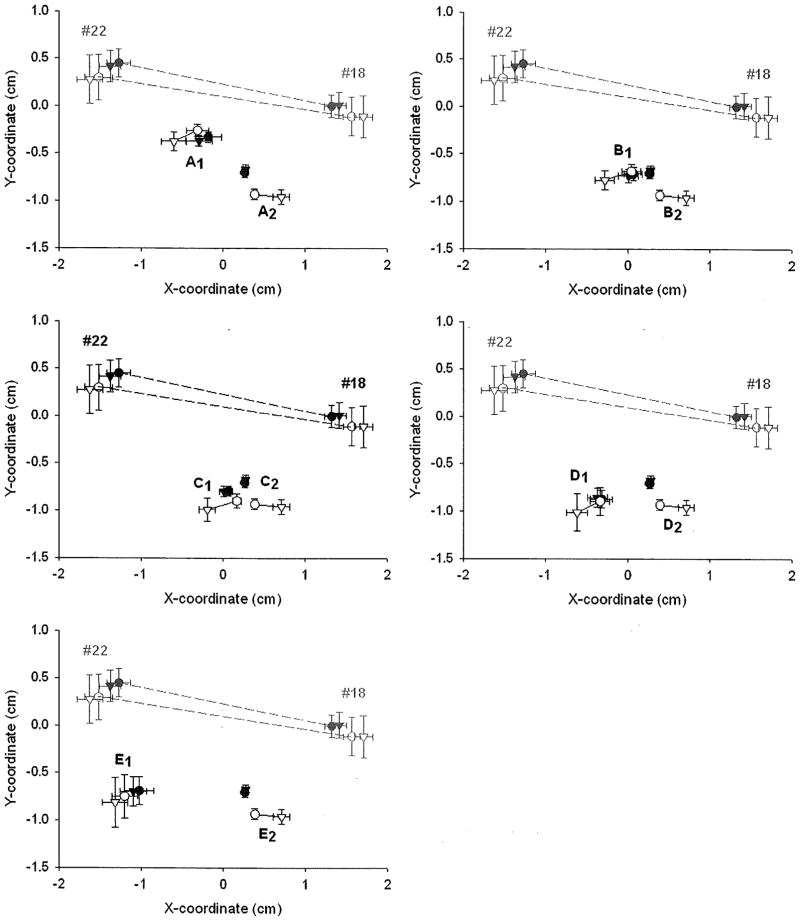
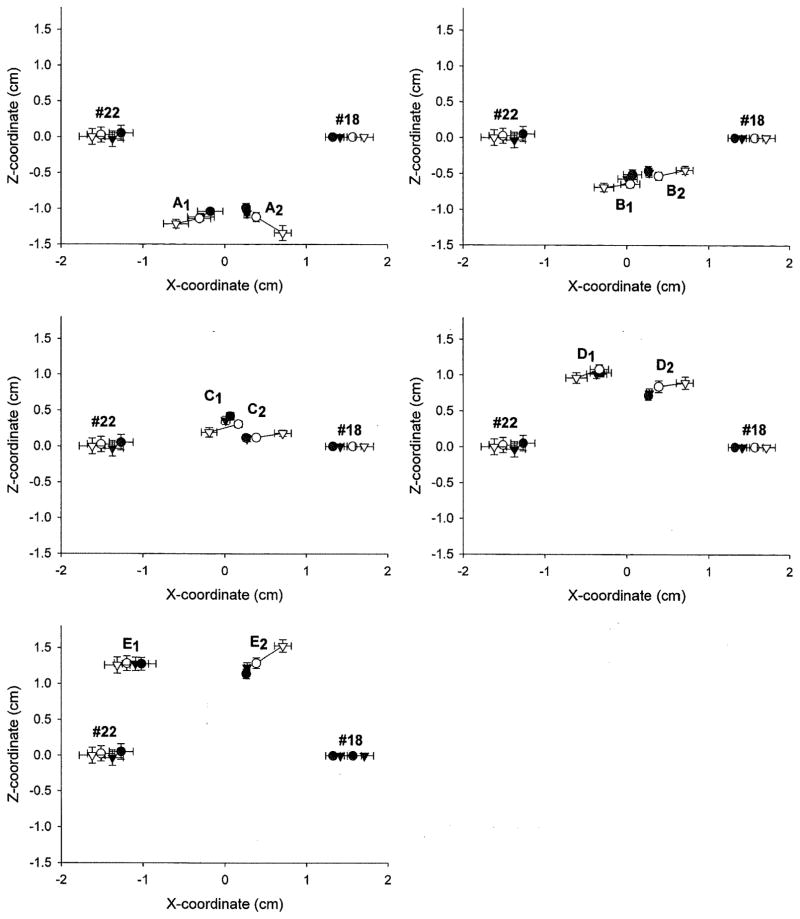
Methods: Ten radiopaque markers were sutured in pairs on the anterior (A1-E1) and corresponding posterior (A2-E2) leaflet edges from the anterior (A1/A2) to the posterior (E1/E2) commissure in 11 adult sheep. Immediately after surgery, 4-D marker coordinates were obtained before and during occlusion of the proximal left circumflex coronary artery. Distances between marker pairs were calculated throughout the cardiac cycle every 16.7 ms. Leaflet opening was defined as the time after end-systole (ES) when the first derivative of the distance between marker pairs was greater than a threshold value of 3 cm/s. Valve opening velocity was defined as the maximum slope of marker pair tracings.
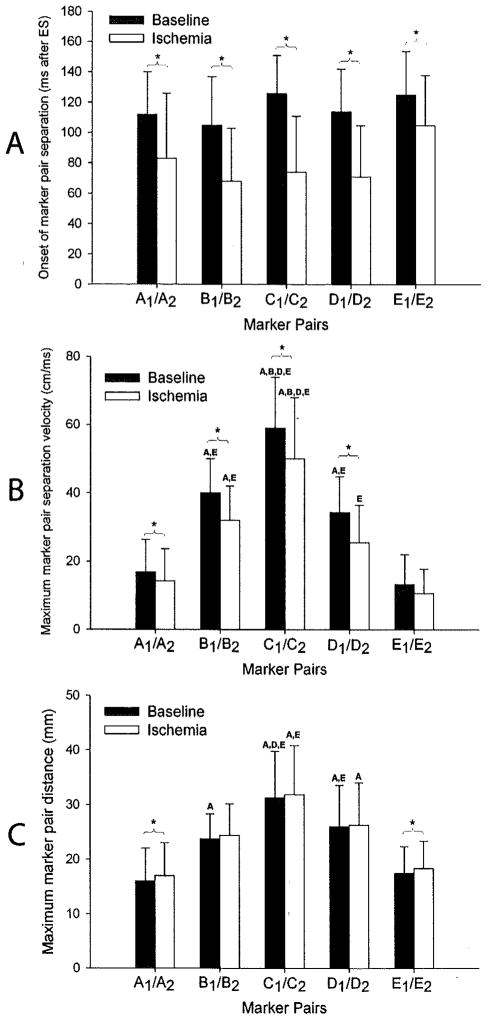
Results: Hemodynamics were consistent with acute ischemia, as reflected by increased MR grade (0.5 +/- 0.3 versus 2.3 +/- 0.7, p < 0.05), decreased contractility (dP/dt(max): 1,948 +/- 598 versus 1,119 +/- 293 mmHg/s, p < 0.05), and slower left ventricular relaxation rate (dP/dt(min): -1,079 +/- 188 versus -538 +/- 147 mmHg/s, p < 0.05). During ischemia, valve opening occurred earlier (A1/A2: 112 +/- 28 versus 83 +/- 43 ms, B1/B2: 105 +/- 32 versus 68 +/- 35 ms, C1/C2: 126 +/- 25 versus 74 +/- 37 ms, D1/D2: 114 +/- 28 versus 71 +/- 34 ms, E1/E2: 125 +/- 29 versus 105 +/- 33 ms; all p < 0.05) and was slower (A1/A2: 16.8 +/- 9.6 versus 14.2 +/- 9.4 cm/s, B1/B2: 40.4 +/- 9.9 versus 32.2 +/- 10.0 cm/s, C1/C2: 59.0 +/- 14.9 versus 50.4 +/- 18.1 cm/s, D1/D2: 34.4 +/- 10.4 versus 25.5 +/- 10.9 cm/s; all p < 0.05), except at the posterior edge (E1/E2: 13.3 +/- 8.7 versus 10.6 +/- 7.2 cm/s). The sequence of regional mitral leaflet separation along the line of coaptation did not change with ischemia.
Conclusion: Acute posterolateral left ventricular ischemia causes earlier leaflet opening, probably due to a MR-related elevation in left-atrial pressure; reduces leaflet opening velocity, potentially reflecting an impaired left ventricular relaxation rate; and does not perturb the homogeneous temporal pattern of regional valve opening along the line of coaptation. Future studies will confirm whether these findings are apparent in patients with chronic IMR, and may help to refine the current strategies used to treat IMR.
Figures
Similar articles
-
Effects of acute ischemic mitral regurgitation on three-dimensional mitral leaflet edge geometry.Eur J Cardiothorac Surg. 2008 Feb;33(2):191-7. doi: 10.1016/j.ejcts.2007.10.024. Epub 2007 Dec 3. Eur J Cardiothorac Surg. 2008. PMID: 18321461 Free PMC article.
-
Ischemia in three left ventricular regions: Insights into the pathogenesis of acute ischemic mitral regurgitation.J Thorac Cardiovasc Surg. 2003 Mar;125(3):559-69. doi: 10.1067/mtc.2003.43. J Thorac Cardiovasc Surg. 2003. PMID: 12658198
-
Determinants of evolution and progression of acute ovine ischemic mitral regurgitation.J Heart Valve Dis. 2010 Jul;19(4):420-5; discussion 426. J Heart Valve Dis. 2010. PMID: 20845887
-
Edge-to-edge mitral repair: tension on the approximating suture and leaflet deformation during acute ischemic mitral regurgitation in the ovine heart.Circulation. 2001 Sep 18;104(12 Suppl 1):I29-35. Circulation. 2001. PMID: 11568026
-
The effects on cordal and leaflet stiffness of severe apical, posterior, and outward papillary displacement in advanced ventricular mechanism heart failure and mitral insufficiency.J Heart Valve Dis. 2011 Nov;20(6):608-18. J Heart Valve Dis. 2011. PMID: 22655489 Review.
Cited by
-
Fully automated tracking of cardiac structures using radiopaque markers and high-frequency videofluoroscopy in an in vivo ovine model: from three-dimensional marker coordinates to quantitative analyses.Springerplus. 2016 Feb 29;5:220. doi: 10.1186/s40064-016-1868-3. eCollection 2016. Springerplus. 2016. PMID: 27026914 Free PMC article.
-
In vivo dynamic strains of the ovine anterior mitral valve leaflet.J Biomech. 2011 Apr 7;44(6):1149-57. doi: 10.1016/j.jbiomech.2011.01.020. J Biomech. 2011. PMID: 21306716 Free PMC article.
References
-
- Lai DT, Tibayan FA, Myrmel T, et al. Mechanistic insights into posterior mitral leaflet inter-scallop malcoaptation during acute ischemic mitral regurgitation. Circulation. 2002;106:140–145. - PubMed
-
- Timek TA, Lai DT, Tibayan F, et al. Ischemia in three left ventricular regions: Insights into the pathogenesis of acute ischemic mitral regurgitation. J Thorac Cardiovasc Surg. 2003;125:559–569. - PubMed
-
- Gorman JH, III, Gorman RC, Jackson BM, et al. Distortions of the mitral valve in acute ischemic mitral regurgitation. Ann Thorac Surg. 1997;64:1026–1031. - PubMed
-
- Otsuji Y, Gilon D, Jiang L, et al. Restricted diastolic opening of the mitral leaflets in patients with left ventricular dysfunction: Evidence for increased valve tethering. J Am Coll Cardiol. 1998;32:398–404. - PubMed
-
- Nof E, Glikson M, Bar-Lev D, et al. Mechanism of diastolic mitral regurgitation in candidates for cardiac resynchronization therapy. Am J Cardiol. 2006;97:1611–1614. - PubMed
Publication types
MeSH terms
Grants and funding
LinkOut - more resources
Full Text Sources
Research Materials
Miscellaneous