. 2010 Sep;52(3):833-47.
doi: 10.1016/j.neuroimage.2010.01.047. Epub 2010 Jan 25.

Attractor concretion as a mechanism for the formation of context representations

Affiliations

Attractor concretion as a mechanism for the formation of context representations

Mattia Rigotti et al. Neuroimage. 2010 Sep.

Abstract

Complex tasks often require the memory of recent events, the knowledge about the context in which they occur, and the goals we intend to reach. All this information is stored in our mental states. Given a set of mental states, reinforcement learning (RL) algorithms predict the optimal policy that maximizes future reward. RL algorithms assign a value to each already-known state so that discovering the optimal policy reduces to selecting the action leading to the state with the highest value. But how does the brain create representations of these mental states in the first place? We propose a mechanism for the creation of mental states that contain information about the temporal statistics of the events in a particular context. We suggest that the mental states are represented by stable patterns of reverberating activity, which are attractors of the neural dynamics. These representations are built from neurons that are selective to specific combinations of external events (e.g. sensory stimuli) and pre-existent mental states. Consistent with this notion, we find that neurons in the amygdala and in orbitofrontal cortex (OFC) often exhibit this form of mixed selectivity. We propose that activating different mixed selectivity neurons in a fixed temporal order modifies synaptic connections so that conjunctions of events and mental states merge into a single pattern of reverberating activity. This process corresponds to the birth of a new, different mental state that encodes a different temporal context. The concretion process depends on temporal contiguity, i.e. on the probability that a combination of an event and mental states follows or precedes the events and states that define a certain context. The information contained in the context thereby allows an animal to assign unambiguously a value to the events that initially appeared in different situations with different meanings.


Figures

Figure 1
Figure 1
The two networks of the simulated neural circuit: the Associative Network (AN, top right), and the Context Network (CN, bottom right). The AN and the CN receive inputs from the neurons encoding external events (conditioned and unconditioned stimuli). The AN network contains two populations of neurons, +,−, that encode positive and negative values respectively. These neurons are activated by external events (CSs) in anticipation of reward and punishment. The inhibitory population (INH) mediates the competition between the two populations. The connections from the CS neurons to the AN neurons are plastic and encode the associations between the CS and the predicted US. The CN neurons receive fixed random synaptic connections from both the AN and the external neurons. The neurons in the CN respond to conjunctions of external events and AN states and they are labeled accordingly. The recurrent connections within the CN are plastic and they are modified to learn context representations. After learning, the CN neurons encode the context, and they project back to the AN (described later, in Fig. 4).
Figure 2
Figure 2
Simulated activity of the AN during two trials of the trace conditioning task of Paton et al. (2006). During the first trial CS A is presented, followed by a reward. The AN network is initially in the neutral state ‘0’ in which all populations are inactive (the activity is color coded: blue means inactive, red means active). The presentation of CS A initiates a competition between the positive coding AN population ‘+’ and the negative coding population ‘−’ which, in this simulation, ends with the activation of population ‘+’. The delivery of reward resets the AN to the ‘0’ state. In the second trial CS B activates population ‘−’ and punishment resets it.
Figure 3
Figure 3
Illustrative firing-rate simulations of a typical CN neuron which exhibits mixed selectivity to the conjunction of an external event (CS B) and an AN value state (negative). A. The top plots show firing rate as a function of time for two simulated neurons in response to CS B. The blue trace represents the response of an external neuron encoding CS B, which is at until the presentation of visual stimulus B. The red trace corresponds to the response of a negative value coding neuron of the AN. CS B is already familiar and its value is correctly predicted by the AN. When CS B is shown, the negative value population is activated, and it remains active until the delivery of the US. In the bottom plot, we show the activity of a CN neuron that, by chance, is strongly connected to CS B external neurons and to the negative value coding AN neurons. The response is significantly different from spontaneous firing rate only when CS B is presented, and the negative value AN state wins the competition. B. Mixed selectivity to CS B and negative value. The cell is selective to both the value and the identity of the CS as the neuron responds only to the CS B-Negative combination and not to the other combinations (CS A-Positive, CS A-Negative, CS B-Positive).
Figure 4
Figure 4
The learning dynamics of the CN to AN feedback. This signal is mediated by a layer of feedback neuron selective to CN and external input activity. The synapses connecting the feedback neurons to the AN are modified with the same learning dynamics as the one used for the AN synapses (see Fusi et al. (2007) and the description of the AN dynamics in the Methods).
Figure 5
Figure 5
Recorded activity of OFC and amygdala cells that respond as expected in AN (A,B) and CN (C,D). The activity has been recorded while the monkey was performing the trace-conditioning task for the four possible CS-US pairings. The continuous traces show the activity after the monkey had learned the associations defining Context 1 (A-Positive, B-Negative). The dotted traces show the activity after learning of Context 2 (A-Negative, B-Positive). The AN cells show sustained activity during the trace interval that encodes the value of the CS. These cells have been observed both in the OFC (A) and amygdala (B). The CN cells are selective to specific combinations of CS and value, both in the OFC (C) and the amygdala (D).
Figure 6
Figure 6
First learning phase: from transient events to attractors. A: The scheme of two consecutive trials. In the first trial the presentation of CS A is followed, after a delay, by the delivery of reward. In the second one, CS B is followed by punishment. B: Color coded activity of the AN (red=active, blue=inactive) as a function of time in response to the events depicted in panel A. The simulation starts in an inactive state with neutral value (0). The presentation of CS A induces a transition to a state in which the neurons encoding positive value (+) have self-sustained activity. The activity is shut down by the delivery of reward. Analogously for the CS B-Punishment case. C: Color coded activity of the CN populations as a function of time (red=active in the presence of external input, yellow=active in the absence of external input, light blue=inactive, blue=inactive because of the strong inhibitory input generated by a reset signal). Each row represents the activity of one population that is labeled according to its selectivity (e.g. 0A is a neuron that responds only when the AN is the neutral state and CS A is presented). The external events together with the activation of positive and negative states of the AN activate the populations of the CN (red bars). Every time a different population is activated a reset signal is delivered (blue stripe). D: First CN attractors: the synapses within each repeatedly activated population are strengthened to the point that the activity self-sustains also after the event terminates (yellow bars).
Figure 7
Figure 7
Second learning phase: attractor concretion. A: Scheme of two trials and color coded activity of the AN as a function of time as in Fig. 6. B,C,D,E From left to right: Scheme of propensities to concretion, scheme of attractors following concretion, Color coded activity of the CN populations as a function of time as in Fig. 6 following the concretion. B,C,D,E describe different iterations of the concretion process (see the text for a detailed description).
Figure 8
Figure 8
Full learning simulation. Color coded activity of the CN populations as a function of time as in Fig. 6. Red and blue bars above the plot indicate context 1 and 2 respectively. Temporally contiguous attractors merge into single representations of short temporal sequences (attractor concretion). Eventually, the context representations emerge, and they are demonstrated by the coactivation of the attractors representing all conjunctions of events and AN states in each context (e.g. 0A, A+, +R, R0, 0B, B−, −P, P0 for context 1).
Figure 9
Figure 9
Harnessing the feedback from the CN to the AN: percent of correct predictions of the value of one CS when the new value of the other CS is already known. The performance is estimated immediately after a context switch. In the absence of the context information provided by the CN, the performance is significantly worse (left) than in the presence of CN feedback, when the performance is close to 100%.
Figure 10
Figure 10
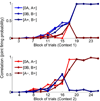
Predictions on the correlations between neurons that respond to conjunctions of events. The probability that two populations of neurons of CN are co-activated is computed by running the simulation several times and it is plotted as a function of the number of blocks of context 1 (top) and context 2 (bottom) trials. Different colors denote different co-activated populations. Initially the probability is zero, as we assumed that in the CN there are only populations that respond to simple conjunctions of events and AN states. As learning progresses, the probability of co-activation of populations that represent events of the context increases. For example, in context 1, neurons that initially respond only to CS A & Positive (A+), after 15 reversals (block 16), respond also to CS B & Negative (B−). The corresponding compound is denoted by [A+,B−].

Similar articles

Cited by

References

    1. Amit D, Brunel N. Learning internal representations in an attractor neural network with analogue neurons. Network: Computation in Neural Systems. 1995;6(3):359–388.
    1. Amit DJ. Modeling Brain Function. Cambridge University Press; 1989.
    1. Asaad WF, Rainer G, Miller EK. Neural activity in the primate prefrontal cortex during associative learning. Neuron. 1998;21(6):1399–1407. - PubMed
    1. Belova MA, Paton JJ, Morrison SE, Salzman CD. Expectation modulates neural responses to pleasant and aversive stimuli in primate amygdala. Neuron. 2007;55(6):970–984. - PMC - PubMed
    1. Belova MA, Paton JJ, Salzman CD. Moment-to-moment tracking of state value in the amygdala. J Neurosci. 2008;28(40):10023–10030. - PMC - PubMed

Publication types

LinkOut - more resources