

Whole genome association study of brain-wide imaging phenotypes for identifying quantitative trait loci in MCI and AD: A study of the ADNI cohort
- PMID: 20100581
- PMCID: PMC2892122
- DOI: 10.1016/j.neuroimage.2010.01.042
Whole genome association study of brain-wide imaging phenotypes for identifying quantitative trait loci in MCI and AD: A study of the ADNI cohort
Abstract
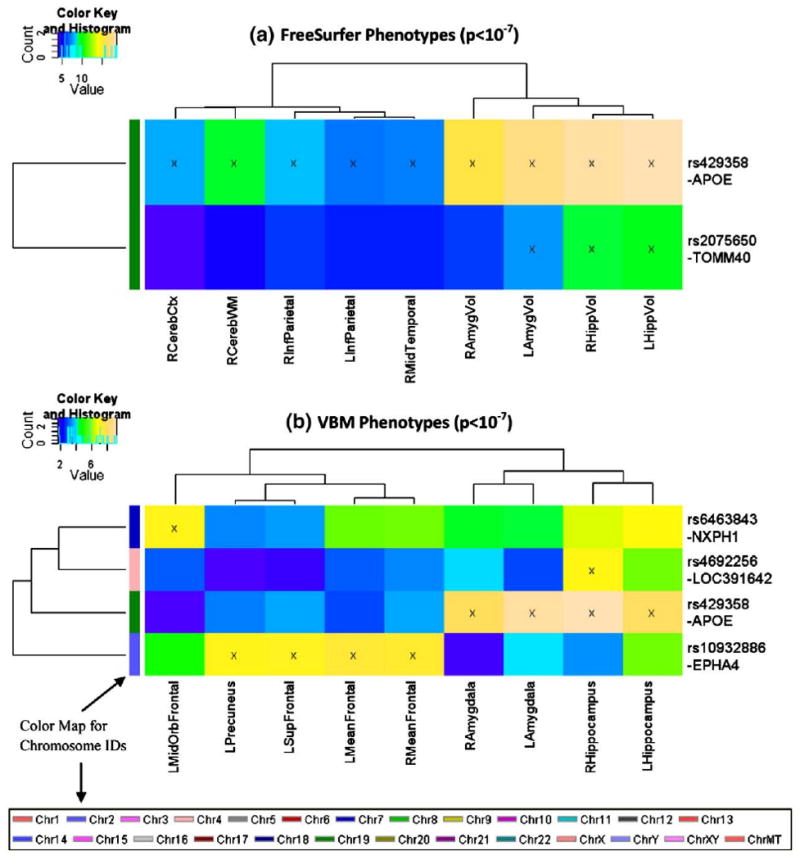
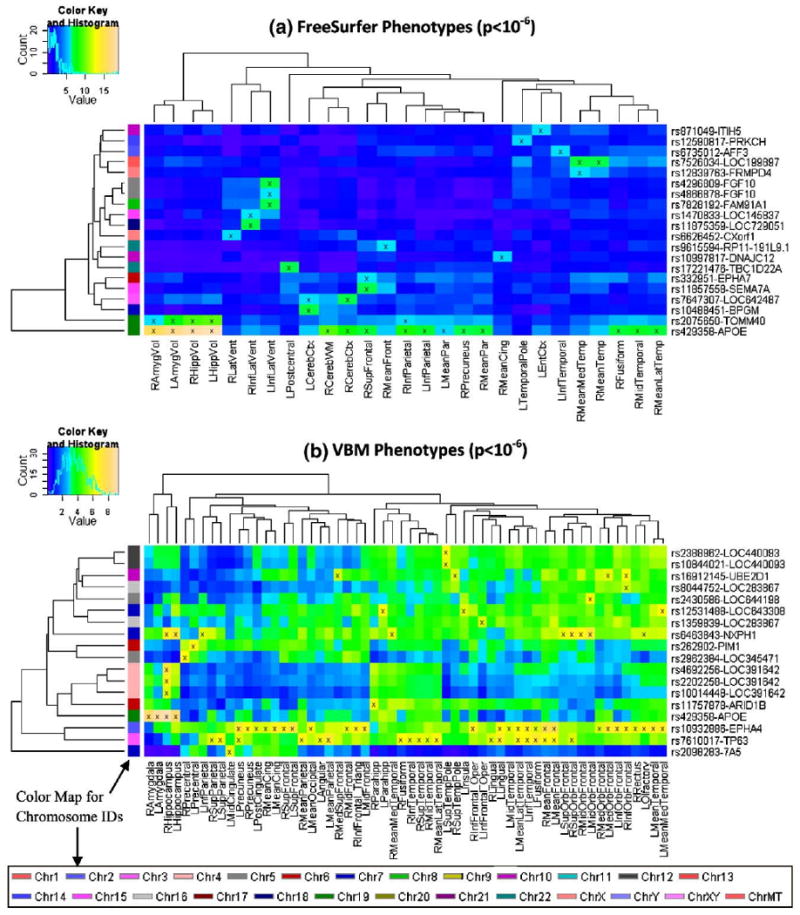
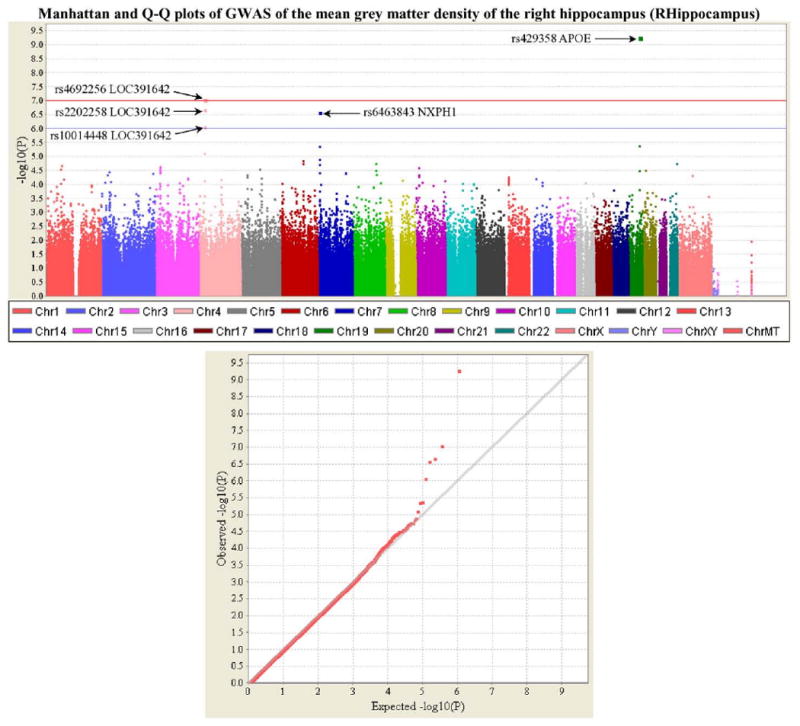
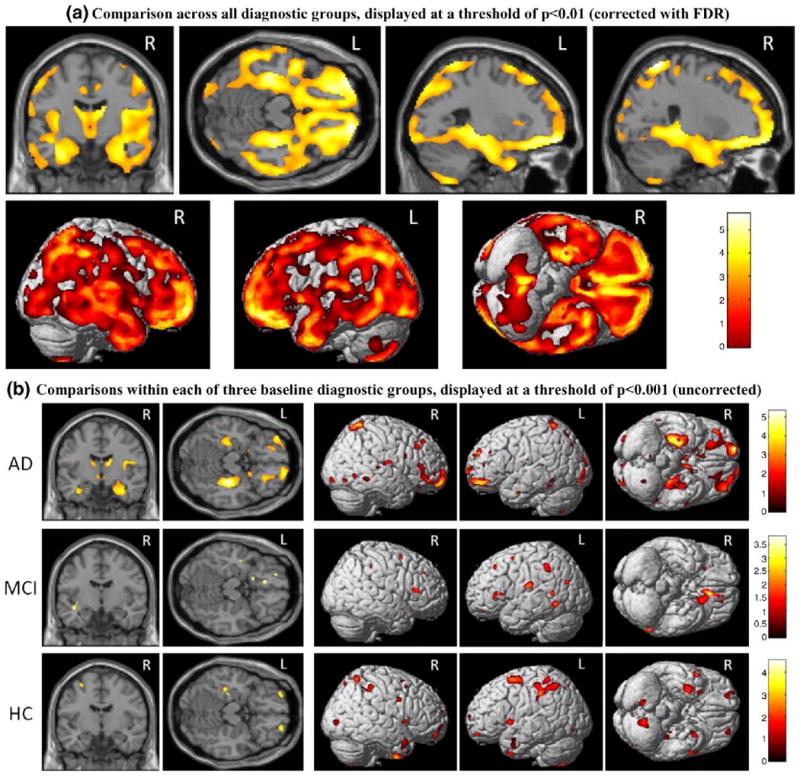
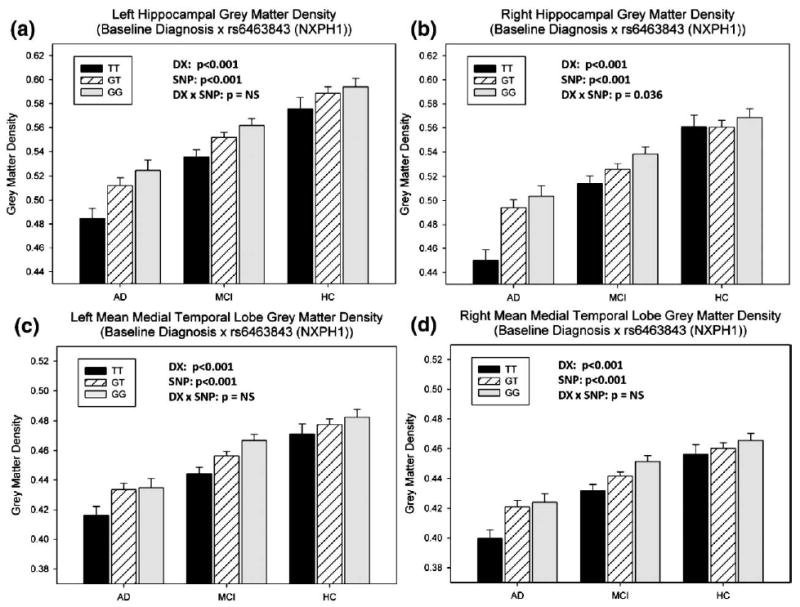
A genome-wide, whole brain approach to investigate genetic effects on neuroimaging phenotypes for identifying quantitative trait loci is described. The Alzheimer's Disease Neuroimaging Initiative 1.5 T MRI and genetic dataset was investigated using voxel-based morphometry (VBM) and FreeSurfer parcellation followed by genome-wide association studies (GWAS). One hundred forty-two measures of grey matter (GM) density, volume, and cortical thickness were extracted from baseline scans. GWAS, using PLINK, were performed on each phenotype using quality-controlled genotype and scan data including 530,992 of 620,903 single nucleotide polymorphisms (SNPs) and 733 of 818 participants (175 AD, 354 amnestic mild cognitive impairment, MCI, and 204 healthy controls, HC). Hierarchical clustering and heat maps were used to analyze the GWAS results and associations are reported at two significance thresholds (p<10(-7) and p<10(-6)). As expected, SNPs in the APOE and TOMM40 genes were confirmed as markers strongly associated with multiple brain regions. Other top SNPs were proximal to the EPHA4, TP63 and NXPH1 genes. Detailed image analyses of rs6463843 (flanking NXPH1) revealed reduced global and regional GM density across diagnostic groups in TT relative to GG homozygotes. Interaction analysis indicated that AD patients homozygous for the T allele showed differential vulnerability to right hippocampal GM density loss. NXPH1 codes for a protein implicated in promotion of adhesion between dendrites and axons, a key factor in synaptic integrity, the loss of which is a hallmark of AD. A genome-wide, whole brain search strategy has the potential to reveal novel candidate genes and loci warranting further investigation and replication.
Copyright 2010 Elsevier Inc. All rights reserved.
Figures
References
-
- Ahmad RH, Emily MD, Daniel RW. Imaging genetics: perspectives from studies of genetically driven variation in serotonin function and corticolimbic affective processing. Biol Psychiatry. 2006;59:888–897. - PubMed
-
- Ashburner J, Friston KJ. Voxel-based morphometry–the methods. Neuroimage. 2000;11:805–821. - PubMed
-
- Balding DJ. A tutorial on statistical methods for population association studies. Nat Rev Genet. 2006;7:781–791. - PubMed
-
- Baranzini SE, Wang J, Gibson RA, Galwey N, Naegelin Y, Barkhof F, Radue EW, Lindberg RL, Uitdehaag BM, Johnson MR, Angelakopoulou A, Hall L, Richardson JC, Prinjha RK, Gass A, Geurts JJ, Kragt J, Sombekke M, Vrenken H, Qualley P, Lincoln RR, Gomez R, Caillier SJ, George MF, Mousavi H, Guerrero R, Okuda DT, Cree BA, Green AJ, Waubant E, Goodin DS, Pelletier D, Matthews PM, Hauser SL, Kappos L, Polman CH, Oksenberg JR. Genome-wide association analysis of susceptibility and clinical phenotype in multiple sclerosis. Hum Mol Genet. 2009;18:767–778. - PMC - PubMed
Publication types
MeSH terms
Substances
Grants and funding
- R01 AG022374/AG/NIA NIH HHS/United States
- R01 AG012101/AG/NIA NIH HHS/United States
- R01 AG19771/AG/NIA NIH HHS/United States
- P30 AG019610/AG/NIA NIH HHS/United States
- R01 NS059873/NS/NINDS NIH HHS/United States
- R01 AG019771/AG/NIA NIH HHS/United States
- UL1 RR025761/RR/NCRR NIH HHS/United States
- P30 AG010133/AG/NIA NIH HHS/United States
- U24 AG021886/AG/NIA NIH HHS/United States
- P30AG10133/AG/NIA NIH HHS/United States
- R03 EB008674/EB/NIBIB NIH HHS/United States
- U01 AG024904/AG/NIA NIH HHS/United States
- U19 AG010483/AG/NIA NIH HHS/United States
- RC2 AG036535/AG/NIA NIH HHS/United States
- UL1 TR001108/TR/NCATS NIH HHS/United States
LinkOut - more resources
Full Text Sources
Other Literature Sources
Medical
Research Materials
Miscellaneous
