

CD57 expression by T cells in the female genital tract of HIV-zx1 infected women
- PMID: 20100671
- PMCID: PMC2843828
- DOI: 10.1016/j.clim.2009.12.007
CD57 expression by T cells in the female genital tract of HIV-zx1 infected women
Abstract
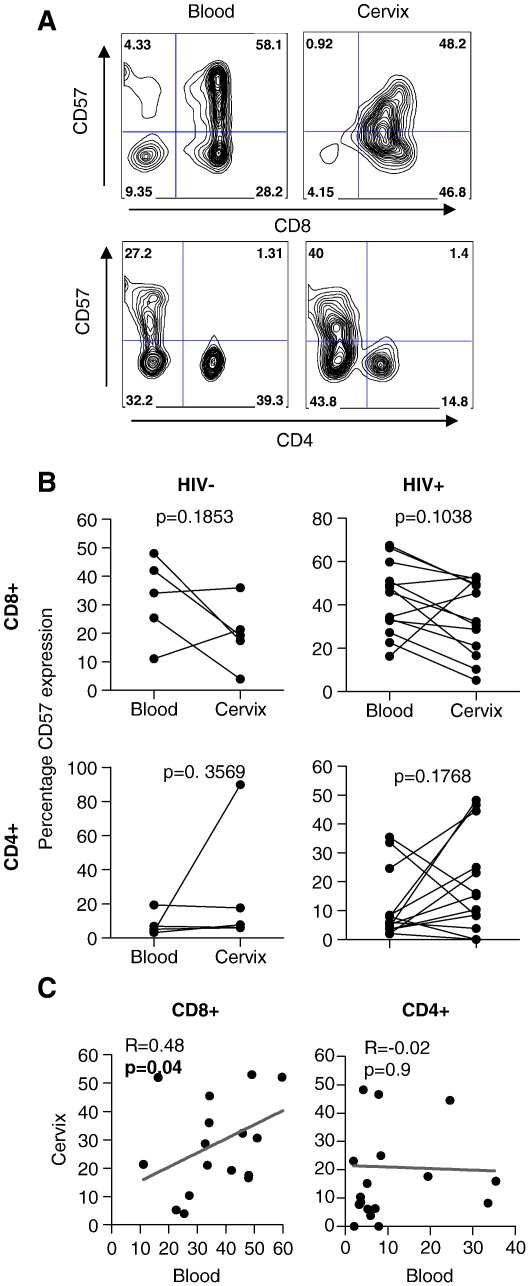
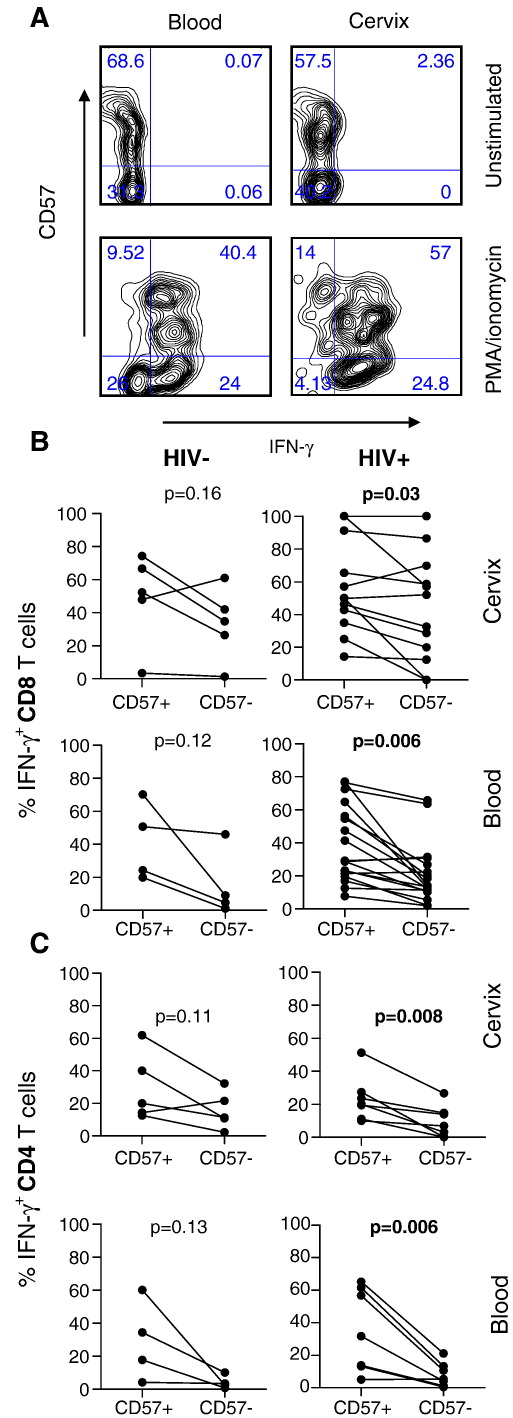
Despite an influx of T cells to the cervix during HIV infection, genital T cells are not associated with control of HIV shedding. CD57 expression by T cells has been associated with enhanced migratory potential and CD57+ T cells have been shown to accumulate in tissues during the late stages of HIV disease. We investigated the impact of HIV-infection and clinical status on the expression of CD57 by T cells from the female genital tract in 13 HIV-infected and 5 uninfected women. We found that cervical and blood-derived T cells expressed similar frequencies of CD57. The frequency of CD57 expression by cervical or blood T cells was not associated with clinical status (CD4 counts). No impairment in IFN-gamma production by CD57+ T cells from the genital tract was observed. We conclude that increased T cell senescence does not appear to be a hallmark of genital mucosal HIV-1 infection.
Copyright 2009 Elsevier Inc. All rights reserved.
Figures
Similar articles
-
HIV-specific T-cell responses detected in the genital tract of chronically HIV-infected women are largely monofunctional.Immunology. 2013 Jul;139(3):342-51. doi: 10.1111/imm.12084. Immunology. 2013. PMID: 23374084 Free PMC article.
-
Functional and phenotypic characterization of CD57+CD4+ T cells and their association with HIV-1-induced T cell dysfunction.J Immunol. 2005 Dec 15;175(12):8415-23. doi: 10.4049/jimmunol.175.12.8415. J Immunol. 2005. PMID: 16339584
-
The proportion of CD57+ cells among effector CD8+ T cells is lower in HIV controllers compared with antiretroviral therapy-treated patients.AIDS. 2019 Nov 15;33(14):2137-2147. doi: 10.1097/QAD.0000000000002342. AIDS. 2019. PMID: 31688039
-
Immune activation in the female genital tract during HIV infection predicts mucosal CD4 depletion and HIV shedding.J Infect Dis. 2011 Nov 15;204(10):1550-6. doi: 10.1093/infdis/jir591. Epub 2011 Sep 21. J Infect Dis. 2011. PMID: 21940422 Free PMC article.
-
Partial recovery of senescence and differentiation disturbances in CD8+ T cell effector-memory cells in HIV-1 infection after initiation of anti-retroviral treatment.Clin Exp Immunol. 2016 Nov;186(2):227-238. doi: 10.1111/cei.12837. Epub 2016 Aug 23. Clin Exp Immunol. 2016. PMID: 27377704 Free PMC article.
Cited by
-
T cells expanded in presence of IL-15 exhibit increased antioxidant capacity and innate effector molecules.Cytokine. 2011 Aug;55(2):307-17. doi: 10.1016/j.cyto.2011.04.014. Epub 2011 May 23. Cytokine. 2011. PMID: 21602054 Free PMC article.
-
Stability and transport of cervical cytobrushes for isolation of mononuclear cells from the female genital tract.J Immunol Methods. 2011 Mar 31;367(1-2):47-55. doi: 10.1016/j.jim.2011.01.013. Epub 2011 Feb 12. J Immunol Methods. 2011. PMID: 21324321 Free PMC article.
References
-
- Cu-Uvin S., Hogan J.W., Warren D., Klein R.S., Peipert J., Schuman P., Holmberg S., Anderson J., Schoenbaum E., Vlahov D., Mayer K.H. Prevalence of lower genital tract infections among human immunodeficiency virus (HIV)-seropositive and high-risk HIV-seronegative women. Clin. Infect. Dis. 1999;29:1145–1150. - PubMed
-
- Moodley P., Connolly C., Sturm A.W. Interrelationships among HIV-1 infection, bacterial vaginosis, trichomoniasis and the presence of yeasts. J. Infect. Dis. 2002;185:69–73. - PubMed
-
- Sobel J.D. Gynecologic infections in HIV-infected women. Clin. Infect. Dis. 2000;31:1225–1233. - PubMed
-
- Nkwanyana N.N., Gumbi P.P., Roberts L., Denny L., Hanekom W., Soares A., Williamson A.L., Coetzee D., Burgers W.A., Passmore J.S. Impact of HIV-1 infection and inflammation on composition and yield of cervical mononuclear cells in the female genital tract. Immunology. 2009;128:e746–e757. - PMC - PubMed
-
- Gumbi P.P., Nkwanyana N.N., Bere A., Burgers W., Williamson A.L., Coetzee D., Hoffman M., Gray C., Denny L., Passmore J.S. Impact of mucosal inflammation on cervical HIV-1-specific CD8 T cell responses and HIV shedding in the female genital tract during chronic HIV infection. J. Virol. 2008;82:8529–8536. - PMC - PubMed
Publication types
MeSH terms
Substances
Grants and funding
LinkOut - more resources
Full Text Sources
Medical
Research Materials
