. 2010 Mar 26;285(13):9327-9338.
doi: 10.1074/jbc.M109.098251. Epub 2010 Jan 25.

The mouse immunoglobulin heavy chain V-D intergenic sequence contains insulators that may regulate ordered V(D)J recombination

Affiliations

The mouse immunoglobulin heavy chain V-D intergenic sequence contains insulators that may regulate ordered V(D)J recombination

Karen Featherstone et al. J Biol Chem. .

Abstract

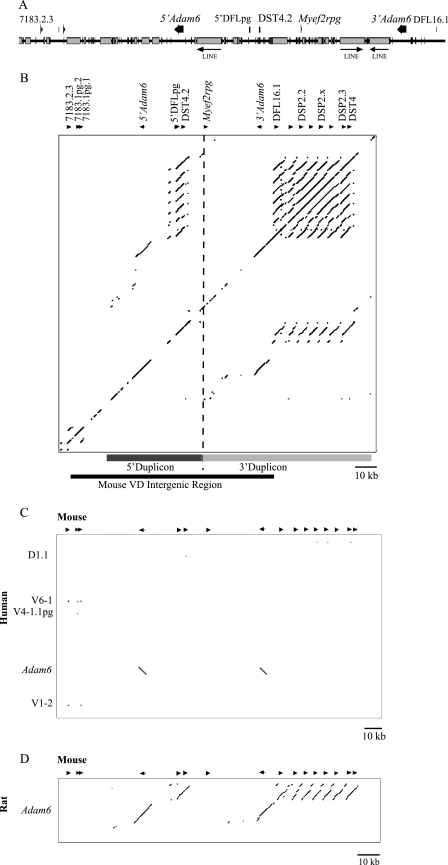
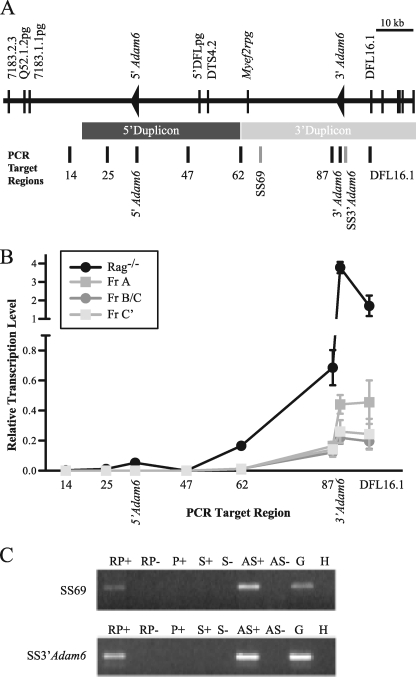
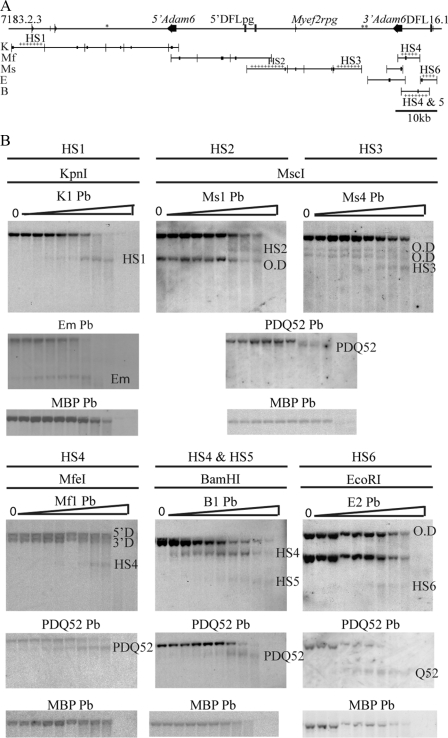
During immunoglobulin heavy chain (Igh) V(D)J recombination, D to J precedes V to DJ recombination in an ordered manner, controlled by differential chromatin accessibility of the V and DJ regions and essential for correct antibody assembly. However, with the exception of the intronic enhancer Emu, which regulates D to J recombination, cis-acting regulatory elements have not been identified. We have assembled the sequence of a strategically located 96-kb V-D intergenic region in the mouse Igh and analyzed its activity during lymphocyte development. We show that Emu-dependent D antisense transcription, proposed to open chromatin before D to J recombination, extends into the V-D region for more than 30 kb in B cells before, during, and after V(D)J recombination and in T cells but terminates 40 kb from the first V gene. Thus, subsequent V antisense transcription before V to DJ recombination is actively prevented and must be independently activated. To find cis-acting elements that regulate this differential chromatin opening, we identified six DNase I-hypersensitive sites (HSs) in the V-D region. One conserved HS upstream of the first D gene locally regulates D genes. Two further conserved HSs near the D region mark a sharp decrease in antisense transcription, and both HSs bind CTCF in vivo. Further, they both possess enhancer-blocking activity in vivo. Thus, we propose that they are enhancer-blocking insulators preventing Emu-dependent chromatin opening extending into the V region. Thus, they are the first elements identified that may control ordered V(D)J recombination and correct assembly of antibody genes.


Figures

FIGURE 1.
FIGURE 1.
The mouse Igh V-D intergenic region has undergone a tandem duplication. A, sequence map of the V-D intergenic region showing the position and orientation of genes (arrows) and repeat sequences (gray boxes) identified. Predicted full-length LINE sequences are labeled. Note in particular the antisense orientation of the Adam6 genes with respect to the orientation of V and D genes. For clarity, locus positions of the Adam6 genes will refer to their geographical position with respect to gene V7183.2.3. B, dot plot showing local alignment of the mouse Igh locus V-D intergenic region against a repeat-masked copy of the same sequence. Arrows, drawn to scale, above the dot plot, show the gene positions and orientations. The 5′ duplicon is indicated by a dark gray line, the 3′ duplicon is shown by a light gray line, and the boundary between them is shown by a dashed line. The black line indicates the V-D intergenic region. C and D, dot plots showing local alignment of the repeat-masked mouse V-D intergenic sequence on the x axis to the human V-D (C) and the partial rat V-D intergenic sequence (D) on the y axis. Genes in the mouse sequence are shown as in B, and genes in the human and rat sequence are labeled.
FIGURE 2.
FIGURE 2.
DH region antisense transcription decreases through the V-D intergenic region. A, schematic representation of the Igh V-D intergenic region illustrating the regions analyzed for transcription by real-time and strand-specific RT-PCR. The numbers below the PCR target regions indicate distance from the 7183.2.3 gene. B, graph depicting relative transcription levels analyzed by real-time RT-PCR in Rag−/− pro-B and wild type fraction A, B/C, and C′ cells. Transcription levels were compared with that of the geNORM housekeeping gene normalization factor for each individual cell type. This value was arbitrarily set to 1. Distance of PCR amplicons from 7183.2.3 is drawn to scale. C, representative examples of PCR products generated by strand-specific RT-PCR. RT reactions were carried out with random hexamers (RP), no primer (P), antisense primer to detect sense transcription (S), or sense primer to detect antisense transcription (AS). RT reactions were performed with (+) and without (−) reverse transcriptase. Genomic DNA (G) and water (W) were included as controls.
FIGURE 3.
FIGURE 3.
Identification of DNase I-hypersensitive sites in the V-D intergenic region. A, schematic representation of the mouse V-D intergenic region showing restriction fragments and positions of probes used in Southern blots to map DNase I hypersensitivity. Enzymes were as follows: ApaI (A), BamHI (B), BglI (BgI), BglII (BgII), BstEII (BsE), BstXI (BsX), EcoRI (E), KpnI (K), MfeI (Mf), MscI (Ms), PstI (P), PvuII (Pv), SapI (Sa), SpeI (S), XbaI (X), and XcmI (Xc). The positions of the probes (Pb) are indicated by black rectangles on the restriction fragment they were used to detect. The asterisks indicate regions that could not be assayed for DNase I HSs, and crosses indicate restriction fragments in which DNase I HSs were detected. B, Southern blots of DNA from Rag2−/− cell line in which DNase I HS sites were identified. Nuclei were treated with 0–1 unit of DNase/2 × 106 nuclei, indicated by triangles. The HSs are named by their position from the V proximal end of the region. The detection of more than one parental band by the cross-hybridization of the probe to the other duplicon (O.D) in the V-D intergenic region is indicated. Southern blots were reprobed with either the PDQ52 probe or Eμ probe as a positive control, followed by reprobing with the Mbp probe as a negative control.
FIGURE 4.
FIGURE 4.
Lineage specificity of DNaseI HSs. Southern blots of DNA from Rag1−/− CD19+ and Rag1−/− CD19 bone marrow cells treated with DNase I are shown. Rag1−/− Southern blots with BamHI digested DNA show nuclei treated with 0.0, 0.3, 0.5, 0.6, 0.8, and 1.0 unit of DNase, indicated by triangles. Rag1−/− Southern blots with ApaI-digested DNA show nuclei treated with 0.0, 0.3, 0.4, 0.5, 0.6, and 0.8 units of DNase, indicated by triangles. Southern blots are labeled by the DNase I HS they were designed to detect and in parentheses the restriction enzymes and probes (Pb) used. Analysis of the β2-microglobulin promoter, and myelin basic protein promoter was carried out on all Southern blots, but only representative results from the BamHI Southern blot are shown. Cross-hybridization of the probe to the other duplicon within the V-D region is labeled by the other duplicon (O.D).
FIGURE 5.
FIGURE 5.
CTCF binding to HS4 and HS5 by chromatin immunoprecipitation. The bar chart depicts results of chromatin immunoprecipitation with an anti-CTCF antibody, followed by real-time PCR analyses in Rag1−/− CD19+ BM cells. Nonspecific binding using a rabbit control antibody was minimal and subtracted before plotting. Results were compared with the input fraction to calculate -fold enrichment. Relative enrichment of the negative control, MTA, was set to 1 for comparison between experiments. For each primer pair, the bars depict a representative biological sample, in which experiments were performed twice in triplicate. Two independent Rag1−/− CD19+ BM samples were immunoprecipitated with anti-CTCF and analyzed in this manner with similar results.
FIGURE 6.
FIGURE 6.
HS4 and HS5 are enhancer blockers. Left, the enhancer-blocking test constructs are depicted, with open rectangles representing the full-length chicken HS4 insulator and the neomycin resistance gene, the latter with an arrow to represent promoter position. The open oval represents the β-globin HS2 enhancer. The AscI restriction enzyme site in pNI is replaced by rounded rectangles representing putative insulator elements in forward (F) or reverse (R) orientation. The filled ovals depict copies of the chicken core HS4 insulator. All constructs derive from pNI. Right, the number of neomycin-resistant colonies, reflecting the enhancer-blocking activity of each construct, was normalized to the backbone vector pNI, which lacked any putative enhancer-blocking elements, set to a value of 1. The data presented are the mean ± S.D. of three independent enhancer-blocking experiments, each with duplicate transfections.

Similar articles

Cited by

References

    1. Corcoran A. E. (2005) Semin. Immunol. 17, 141–154 - PubMed
    1. Jung D., Giallourakis C., Mostoslavsky R., Alt F. W. (2006) Annu. Rev. Immunol. 24, 541–570 - PubMed
    1. Chowdhury D., Sen R. (2001) EMBO J. 20, 6394–6403 - PMC - PubMed
    1. Morshead K. B., Ciccone D. N., Taverna S. D., Allis C. D., Oettinger M. A. (2003) Proc. Natl. Acad. Sci. U.S.A. 100, 11577–11582 - PMC - PubMed
    1. Lennon G. G., Perry R. P. (1985) Nature 318, 475–478 - PubMed

Publication types

LinkOut - more resources